As we wrap up another year, I thought we could take a friendly stroll together through our very own real estate market here in Louisville, KY.
We’ll also take a cozy stop in Middletown to warm ourselves by the fireplace of hard data and heartening market insights.
It’s been a year of twists, turns, and a few surprises in the market. I’m sure you’ll find a few gems in this article.
Just to set the stage, I’ll peek at the bigger picture of Louisville, via Jefferson County’s overall performance comparing statistics from Dec. 2022 to Dec 2023, but I’ll keep it as light and digestible as a slice of your favorite pie.
Then, we’ll narrow our focus to the Middletown neighborhood. Why Middletown, you ask? Well, there has been a lot of activity in that area. For that analysis, we’ll examine the last 180 days of sales activity, so we can have a more current view of the market.
So, grab a seat, and let’s get down to business — the business of understanding our dynamic real estate market, that is. Trust me, it’s as intriguing as the latest neighborhood gossip, only this chat will arm you with insights to make your next move in the market a masterpiece.
Jefferson County Yearly Market Recap
As we bid farewell to another year, let’s take a reflective look at how the Jefferson County (Louisville, KY) real estate market fared from December 2022 to December 2023.
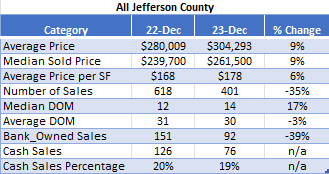
Market Performance Highlights
Average and Median Sold Prices: We’ve witnessed a solid increase in property values with both average and median sold prices swelling by an upbeat 9%.
Price per Square Foot: The details matter, as we’ve seen with the average price per square foot stepping up by 6%. A partial contributor is the increase in home values.
Sales Dynamics
Number of Sales: Here’s where the plot thickens. The number of sales in Louisville, KY has taken a 35% dip. This has definitely caused alarm bells to ring. Is this a sign of a stabilizing market or perhaps a momentary dip in the ever-flowing river of real estate? Only 2024 will tell.
Days on Market (DOM): Properties have been taking a slight detour, with the median DOM increasing by 17%. It’s a modest nudge, suggesting that while homes are still moving, buyers are taking that extra moment to make their decisions.
Specific Trends
Bank-Owned Sales: Bank-owned sales have seen a significant drop of 39%. This could be a beacon of a strengthening economy or a shift in the bank’s approach to property sales.
Cash Sales: While the total number of cash sales has decreased, the percentage of cash transactions has held steady, indicating a consistent segment of the market that prefers the clink of coins over the rustle of banknotes.
Smaller Market Areas within Jefferson County
Diving into the local flavors of Jefferson County, let’s take a closer look at how specific areas have fared, comparing them to the broader strokes of the county canvas.
Valley Station – A Snapshot
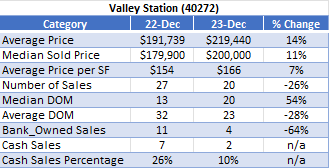
Average Price: The average price in Valley Station saw an impressive leap of 14%, outpacing the county’s overall growth.
Median DOM: Homes in Valley Station have been lingering a little longer on the market, with a notable 54% rise in the median DOM. It’s a curious trend that warrants a watchful eye.
St Matthews – The Upswing
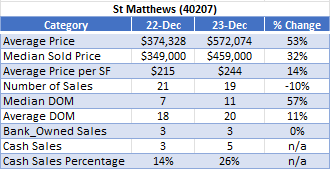
Average Price: St Matthews stands out with a whopping 53% surge in average prices, and a 32% increase in median prices. It’s a huge signal that this area is highly sought after, and properties here are being valued more than ever.
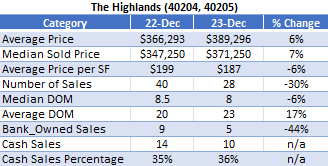
The Highlands – The Mixed Bag
Middletown – The Highlight of Today’s Show
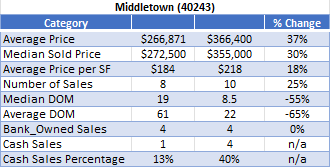
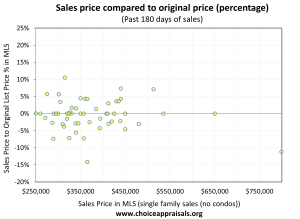
Middletown Market Analysis – The Last 180 Days
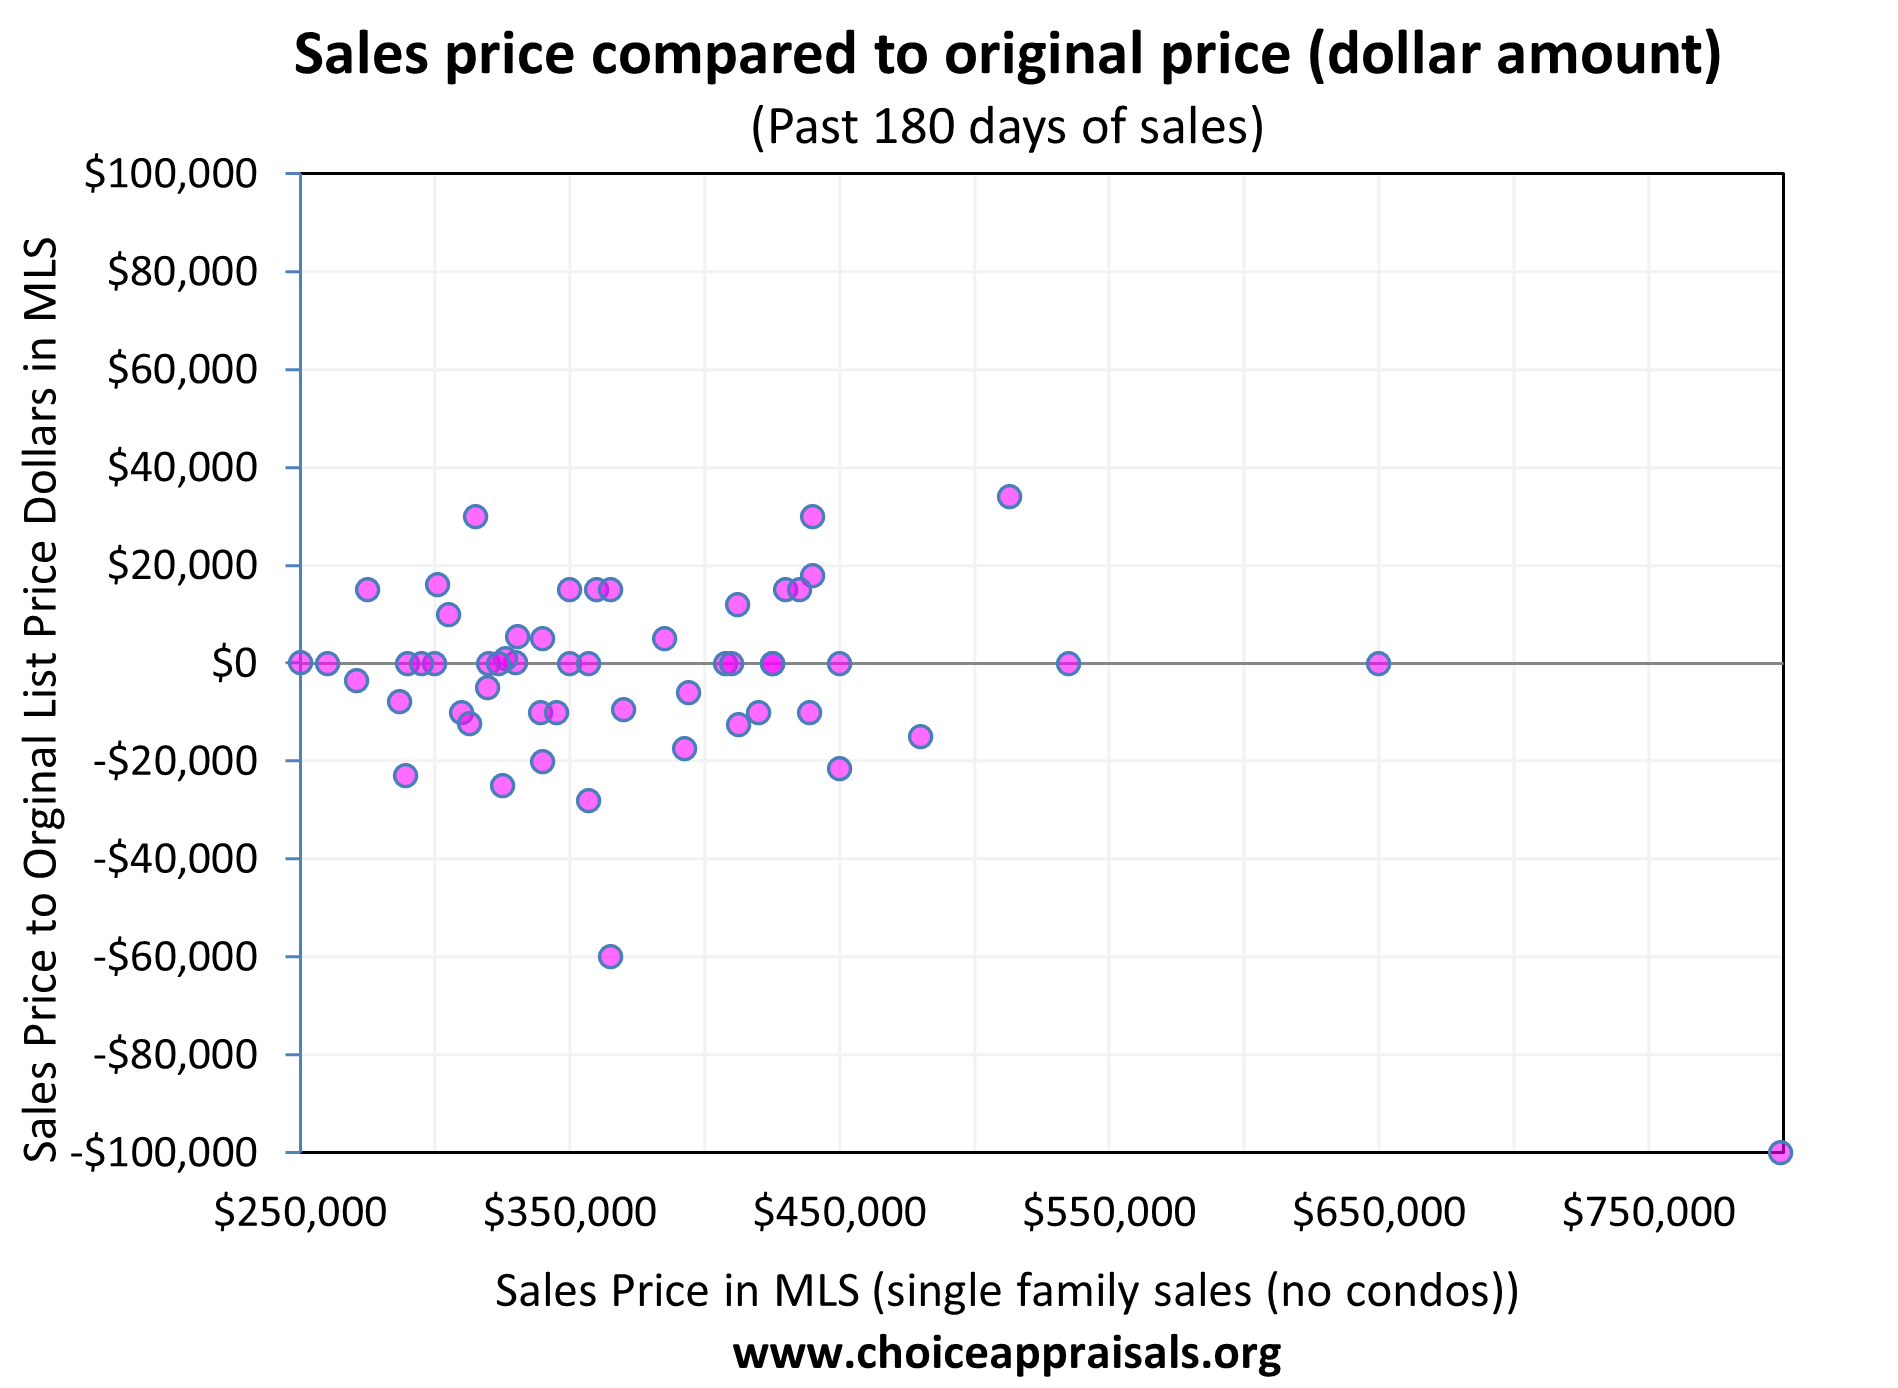
As we focus our lenses closer on Middletown, I have a collection of graphs that give us a snapshot of the real estate dynamics over the past 180 days. From concessions to lot sizes, and days on the market, I’ve got the insights to share. Let’s dive in.
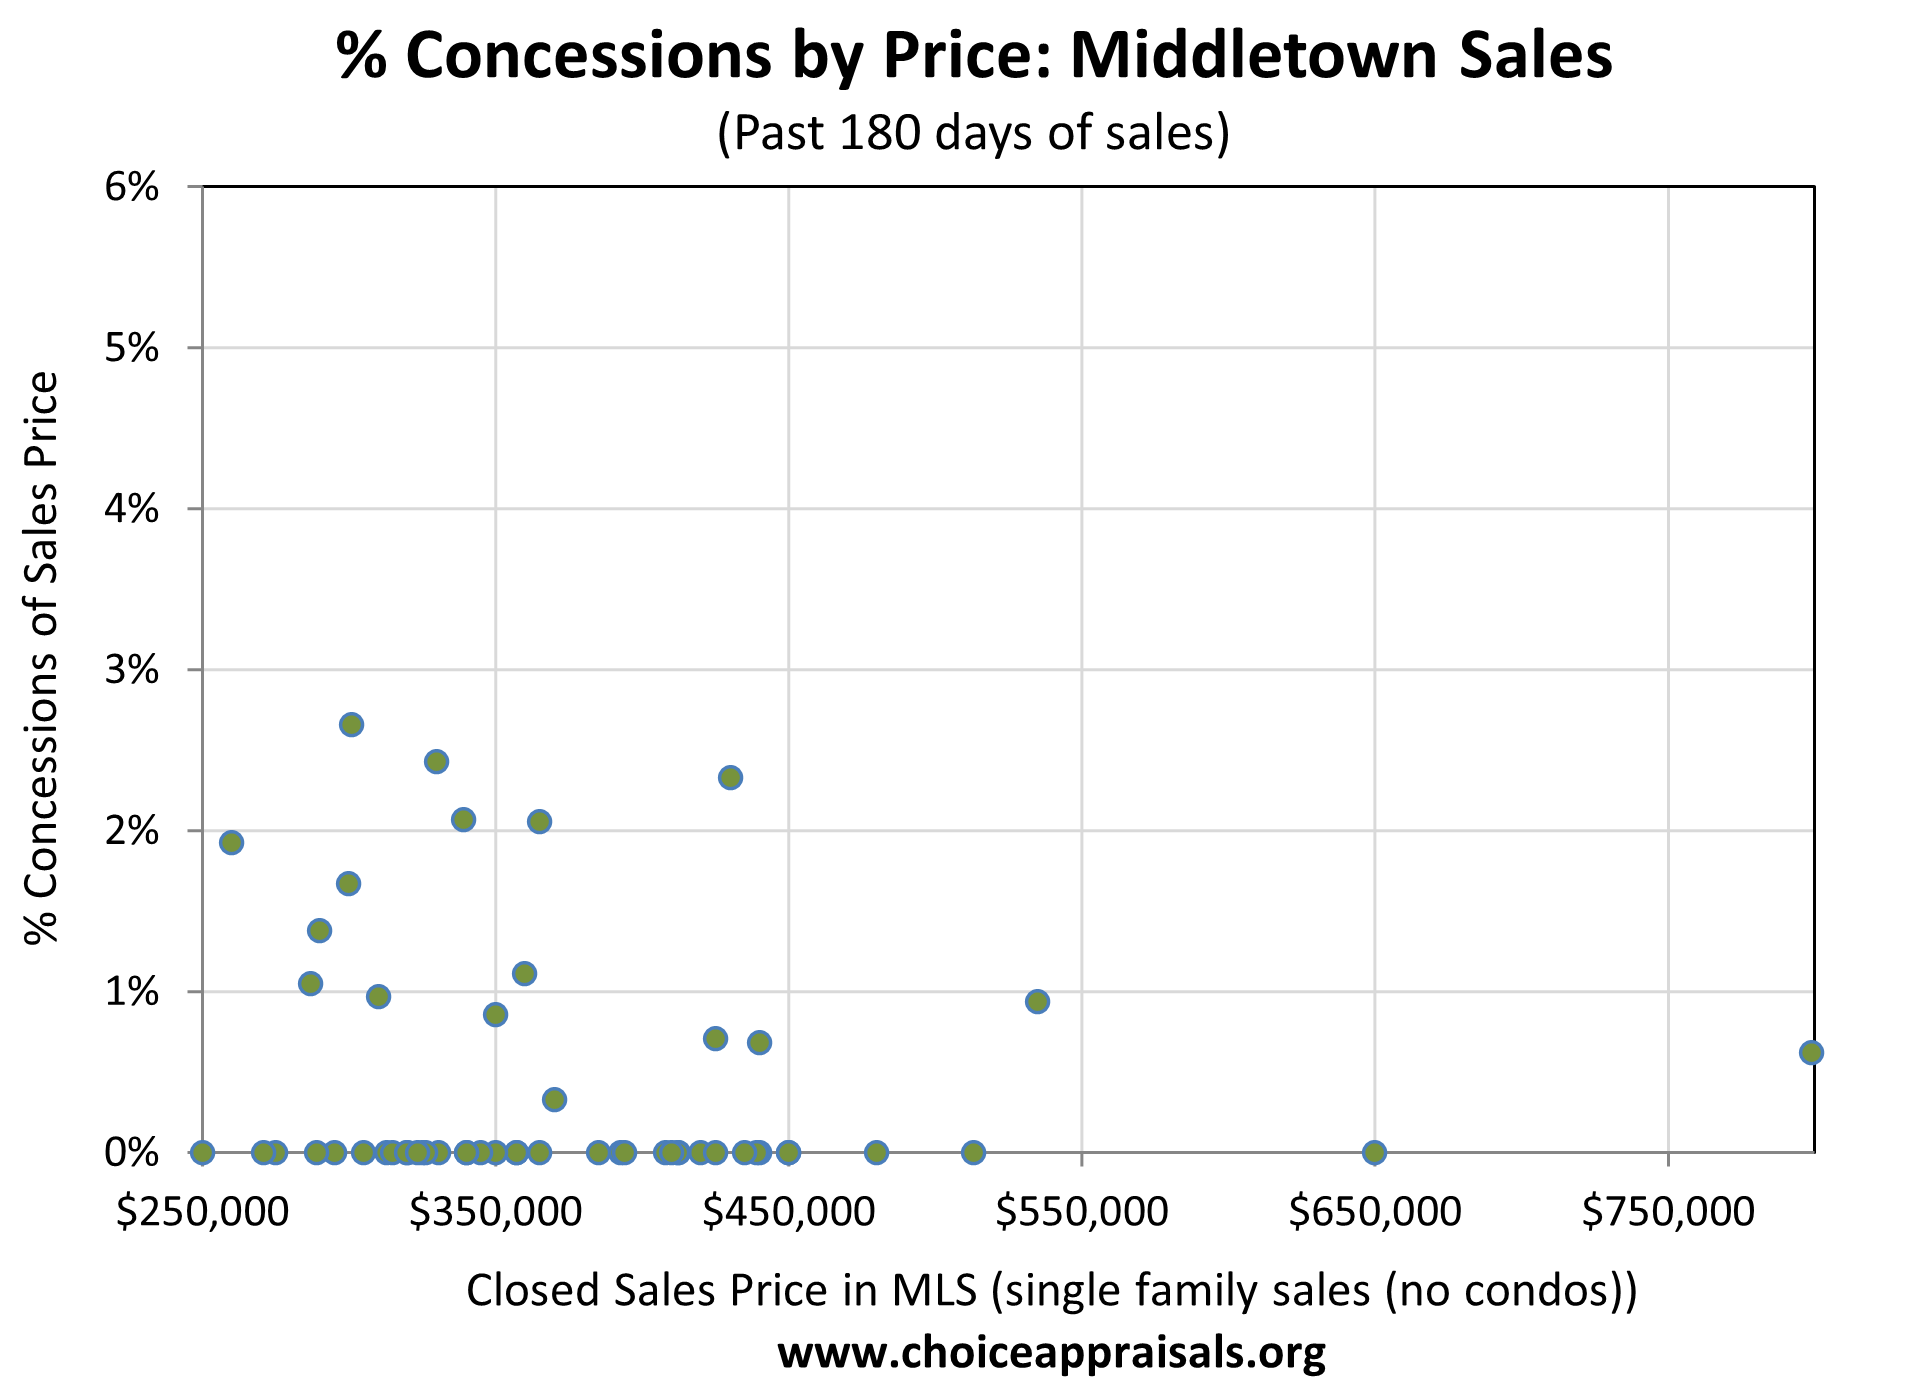
1. Concessions by Price: The trend here indicates that seller concessions are relatively rare and mostly low, even as sale prices vary. This suggests a strong seller’s market in Middletown.
2. Concessions Dollar Amount: Higher-priced homes seem to see larger concessions in absolute dollar terms, yet these remain a small fraction of the overall sale price.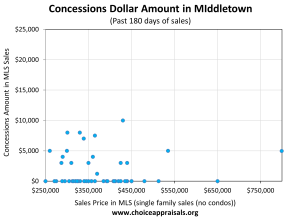
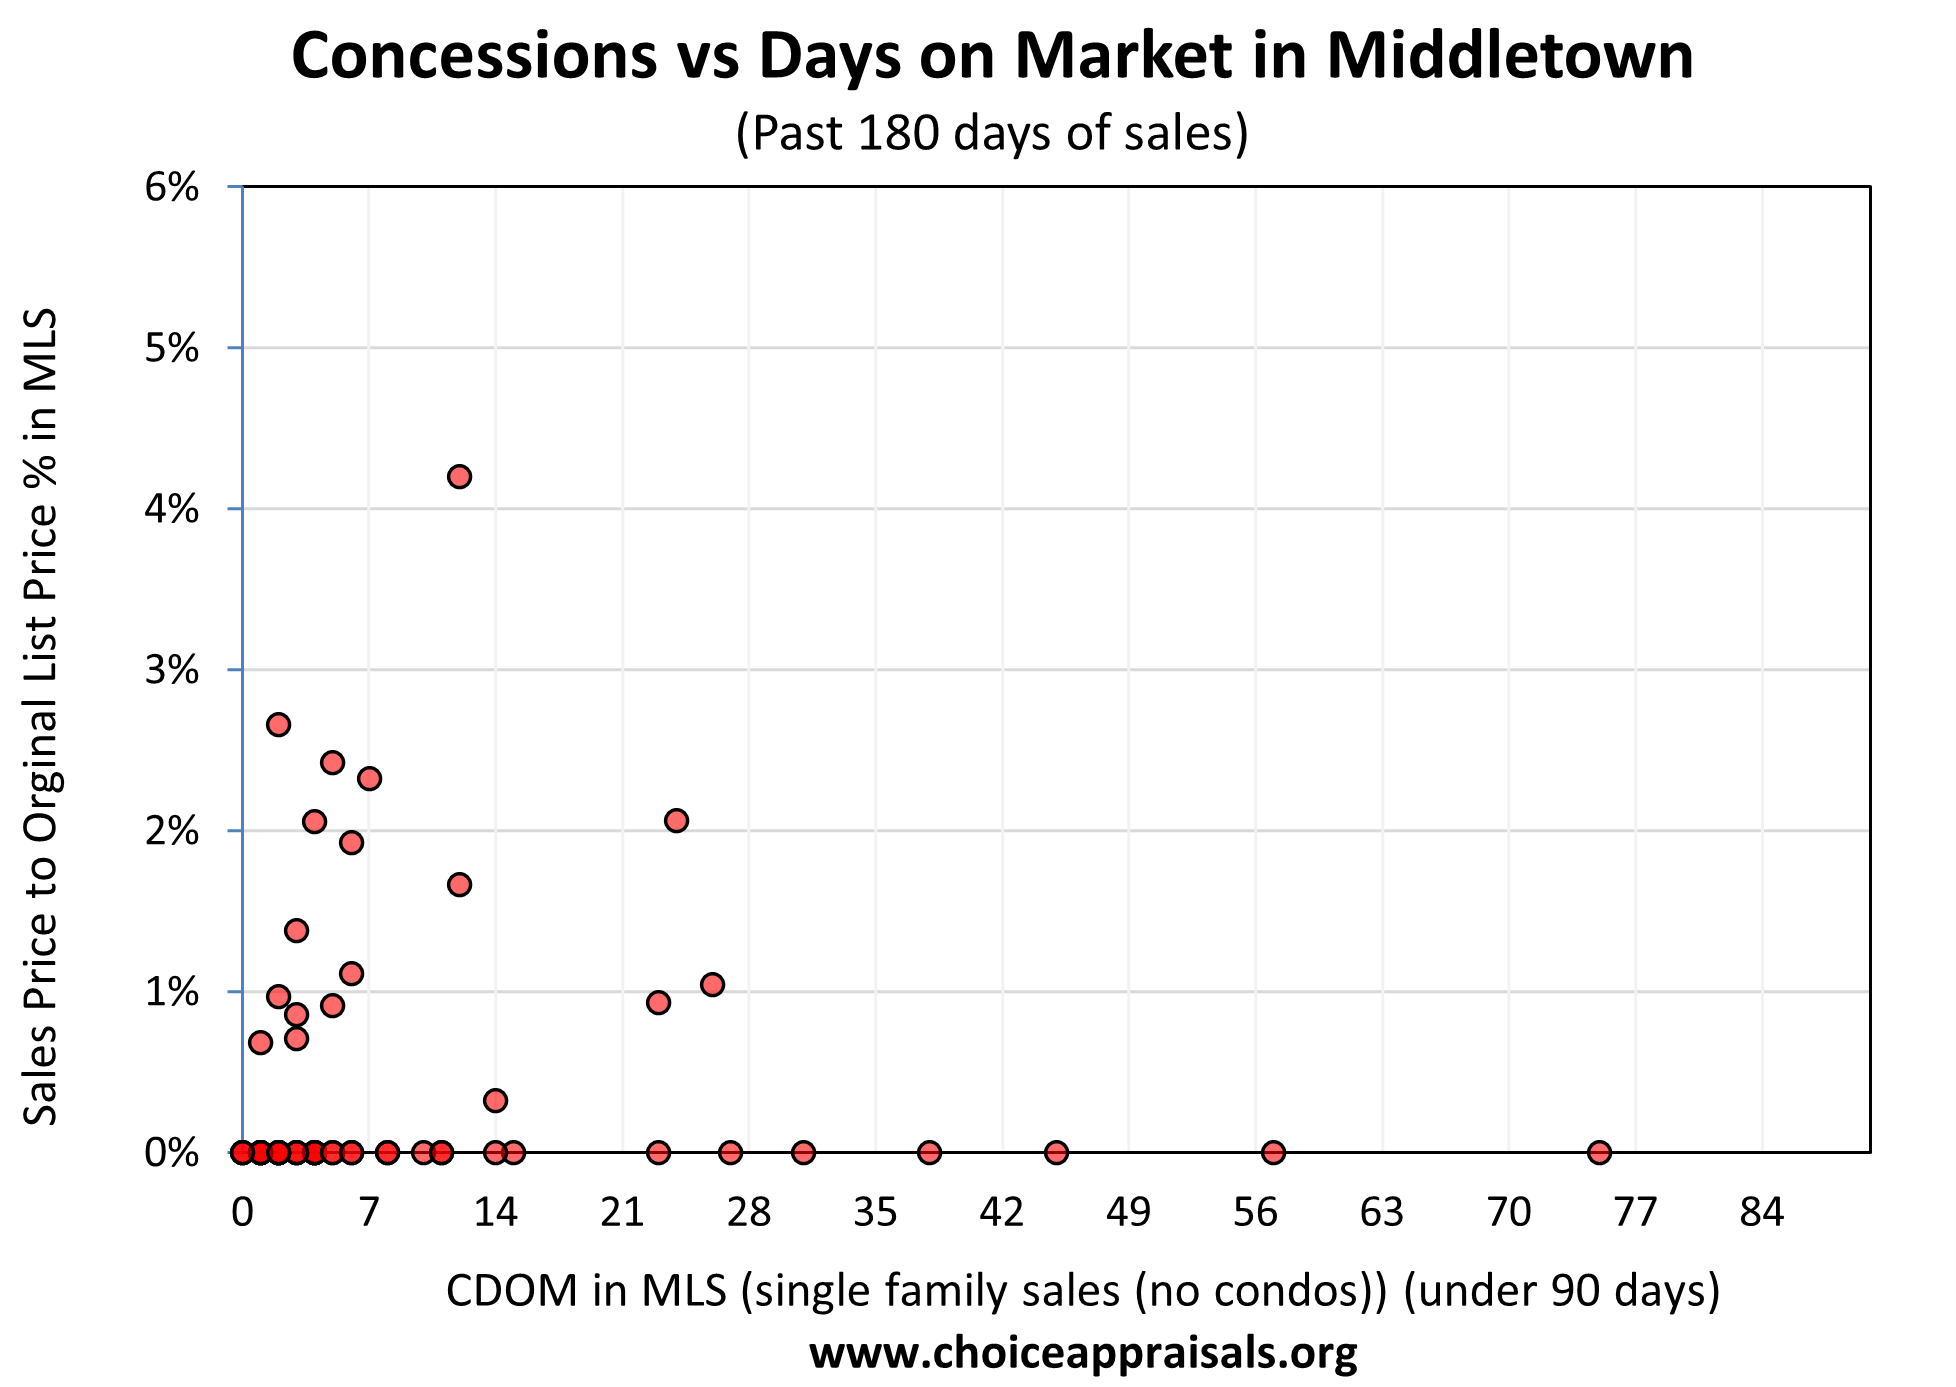
3. Concessions vs Days on Market: There does not seem to be much of an increase in concessions as the days on market increase.
4. Days on Market vs Final Price: The graph depicts a mixed market in Middletown, where homes with shorter days on market often sell close to the list price, yet there are notable concessions even among these quick sales, indicating nuanced buyer-seller negotiations.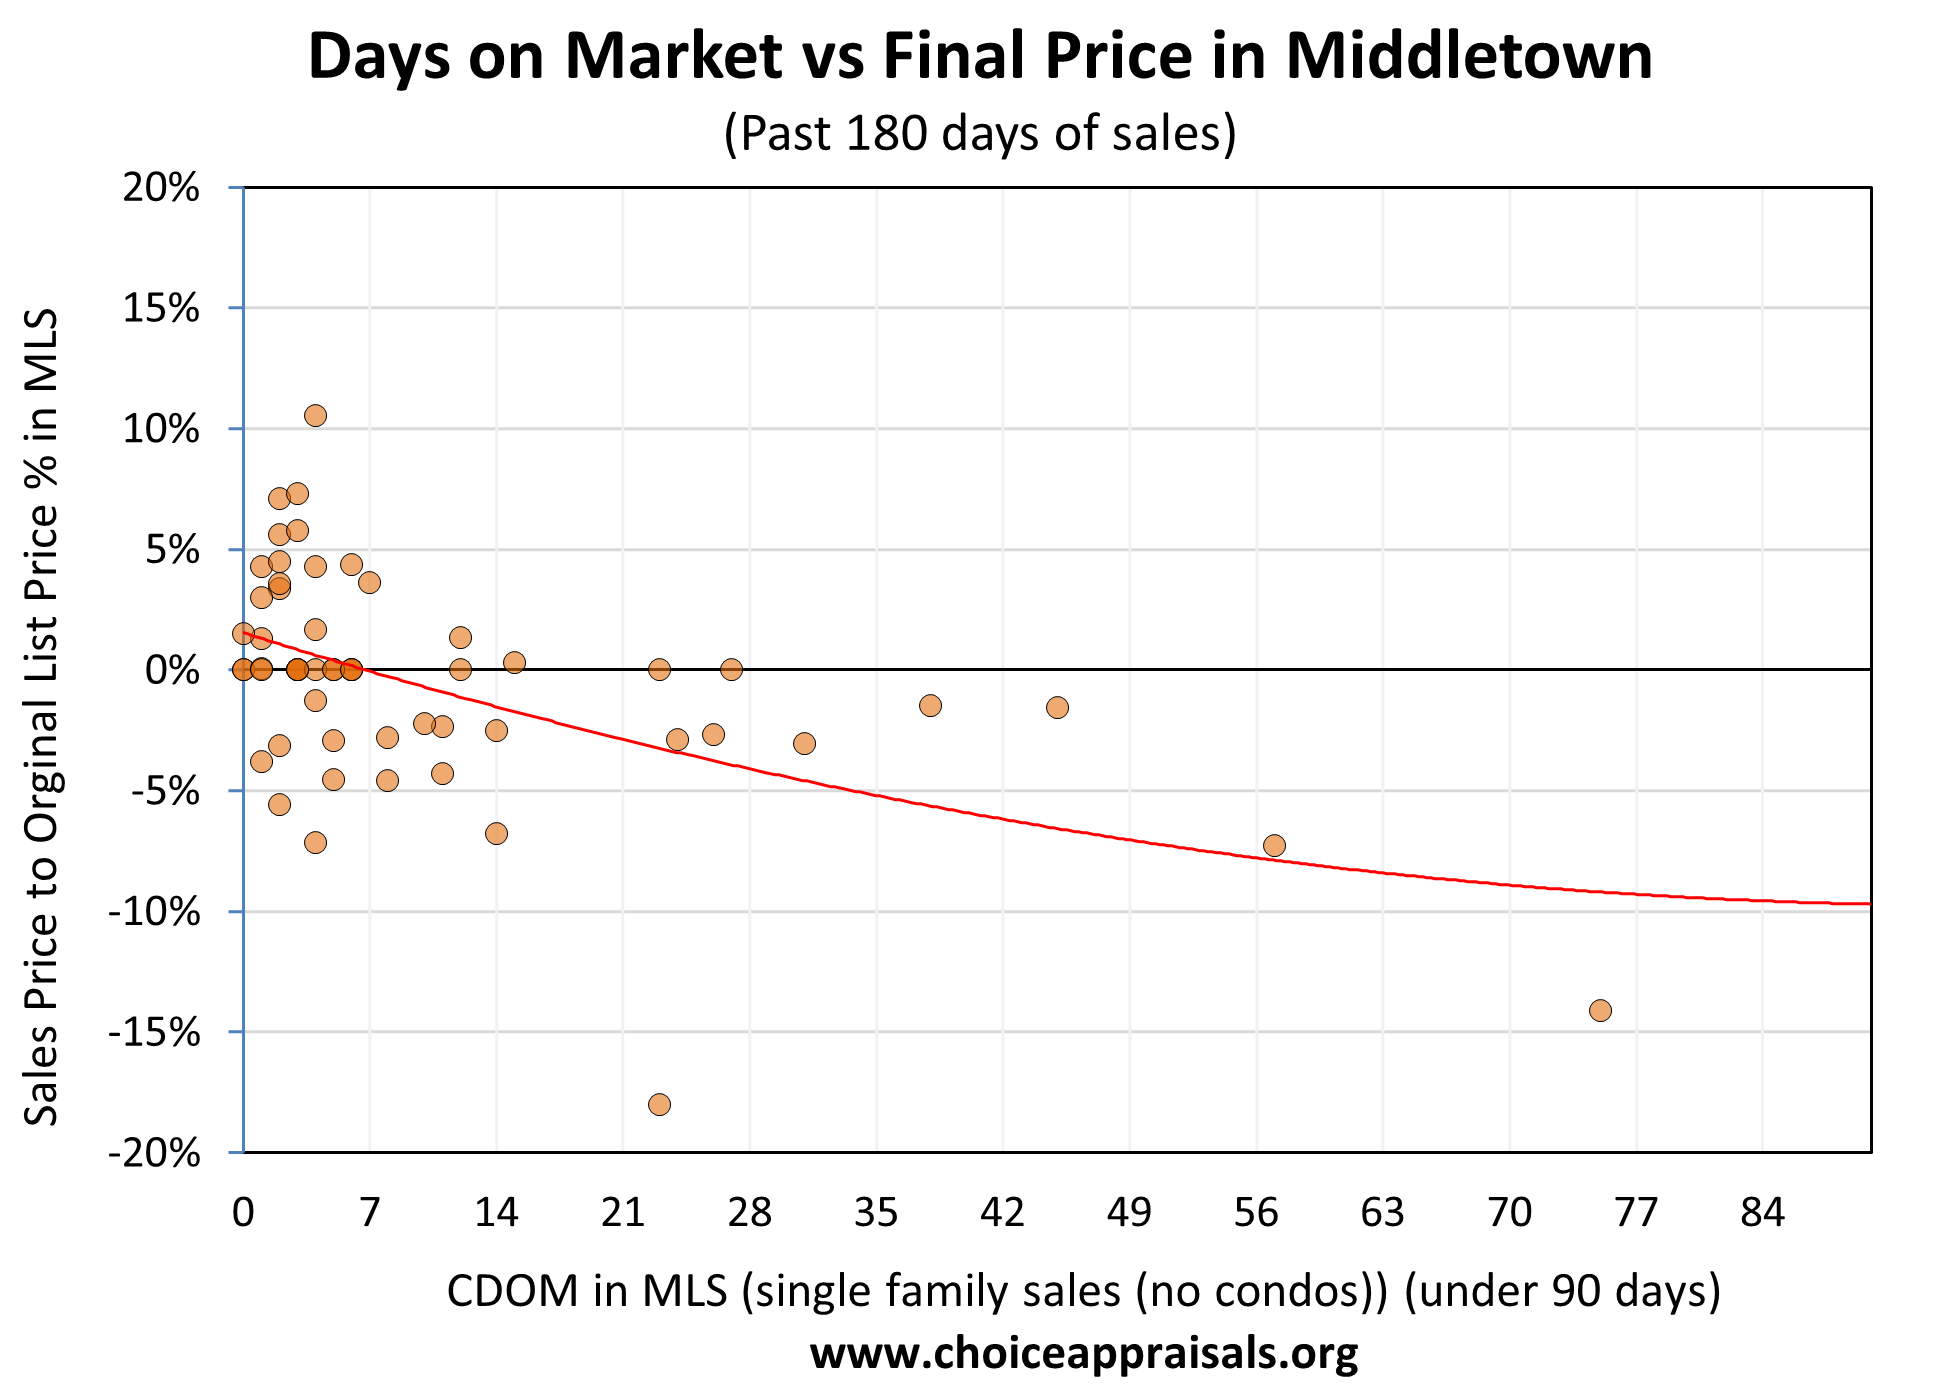
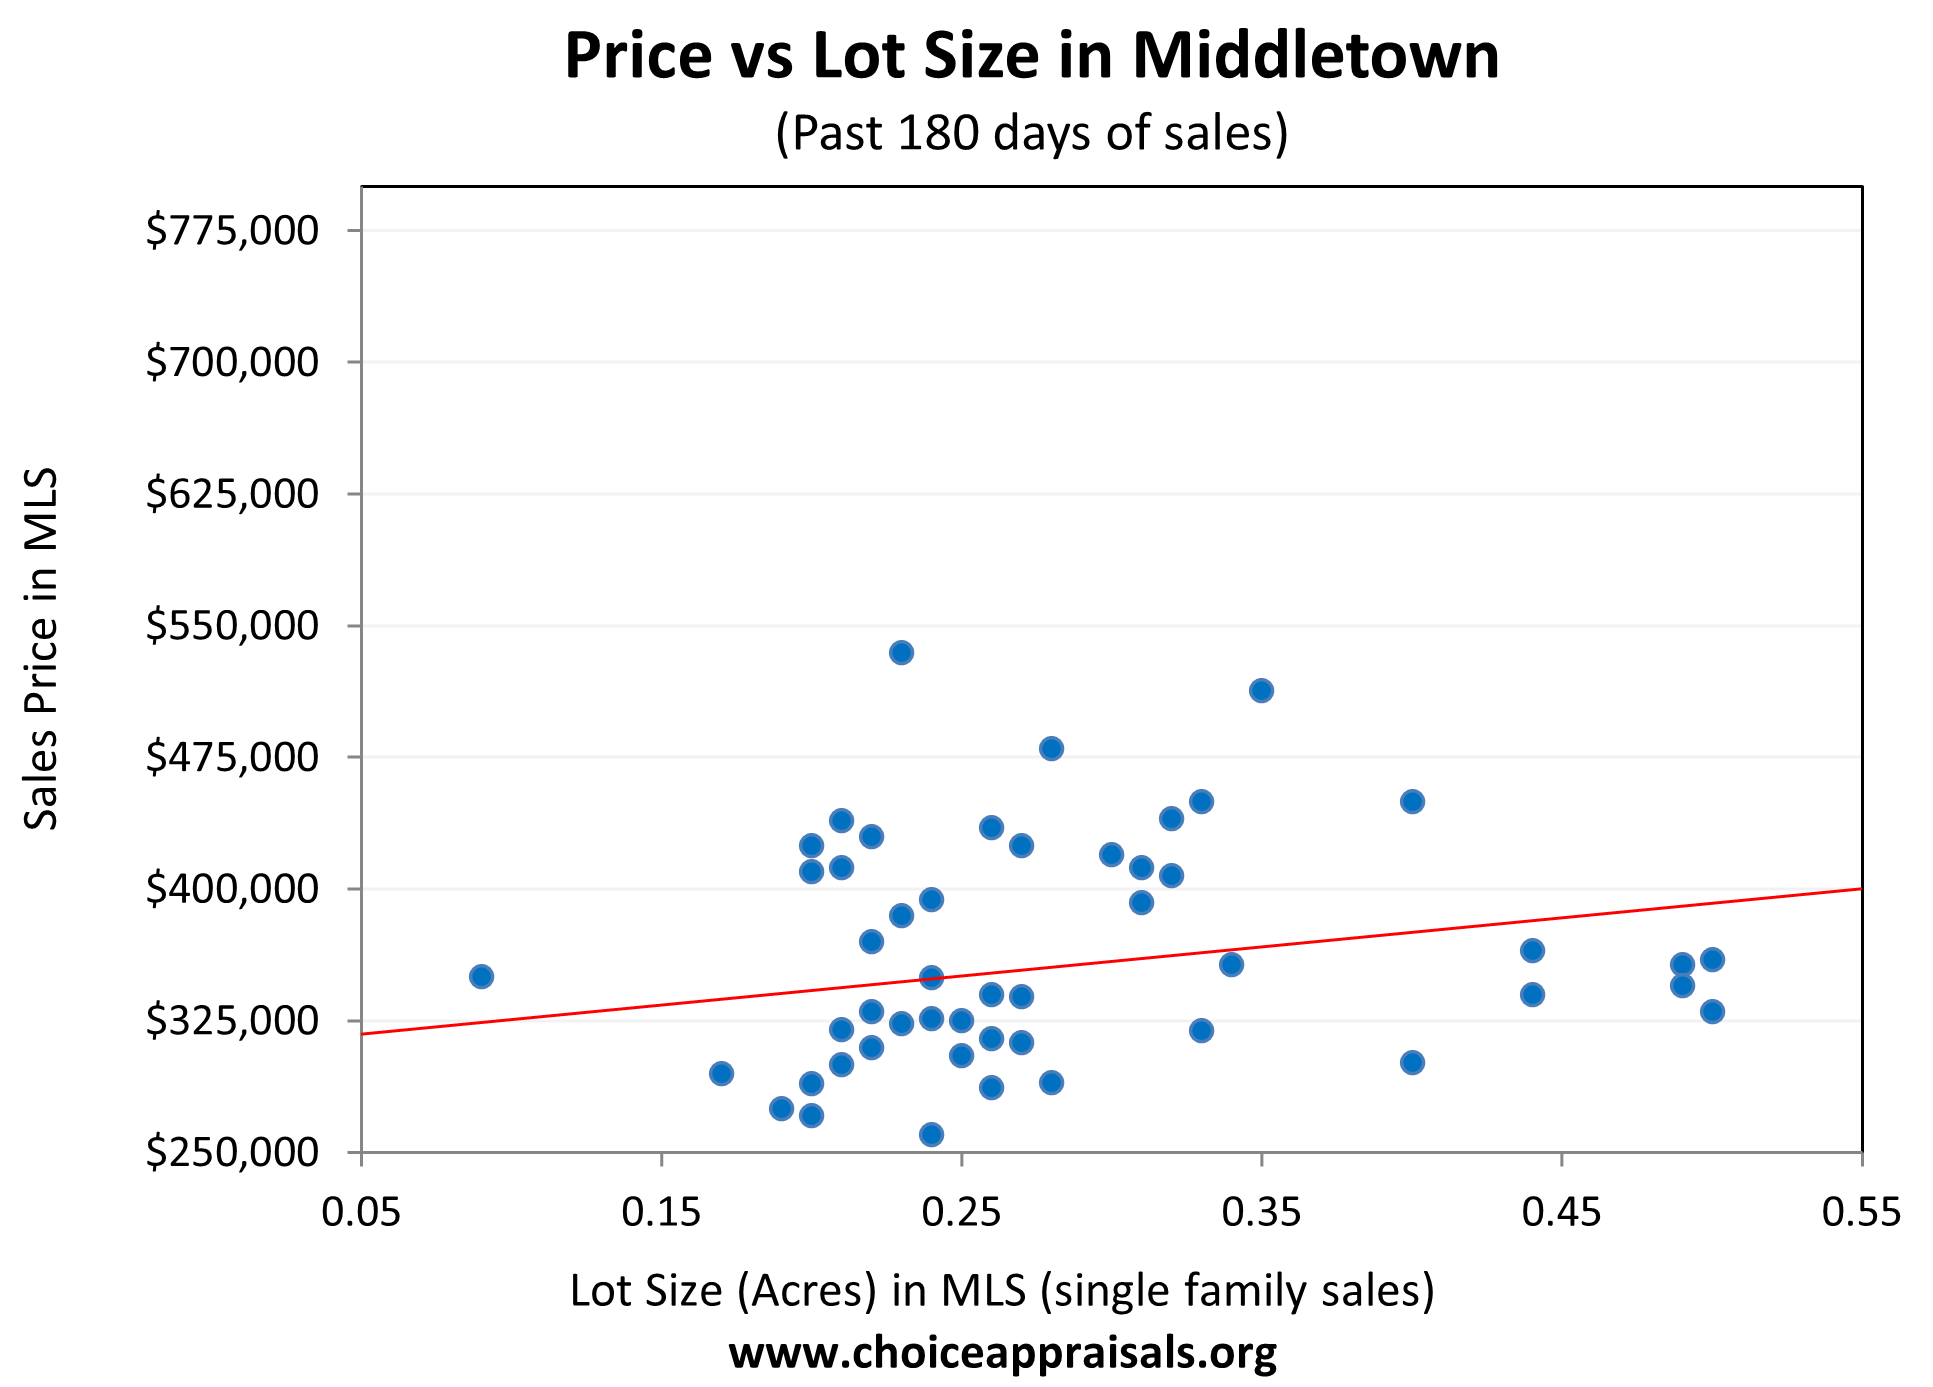
5. Price vs Lot Size: Larger lots tend to fetch higher prices, but there’s a wide range in sale prices across similar lot sizes, indicating that factors beyond just space are at play in pricing.
6. Price vs Square Footage: A clear correlation is seen between larger homes and higher sale prices, though the relationship is not strictly linear.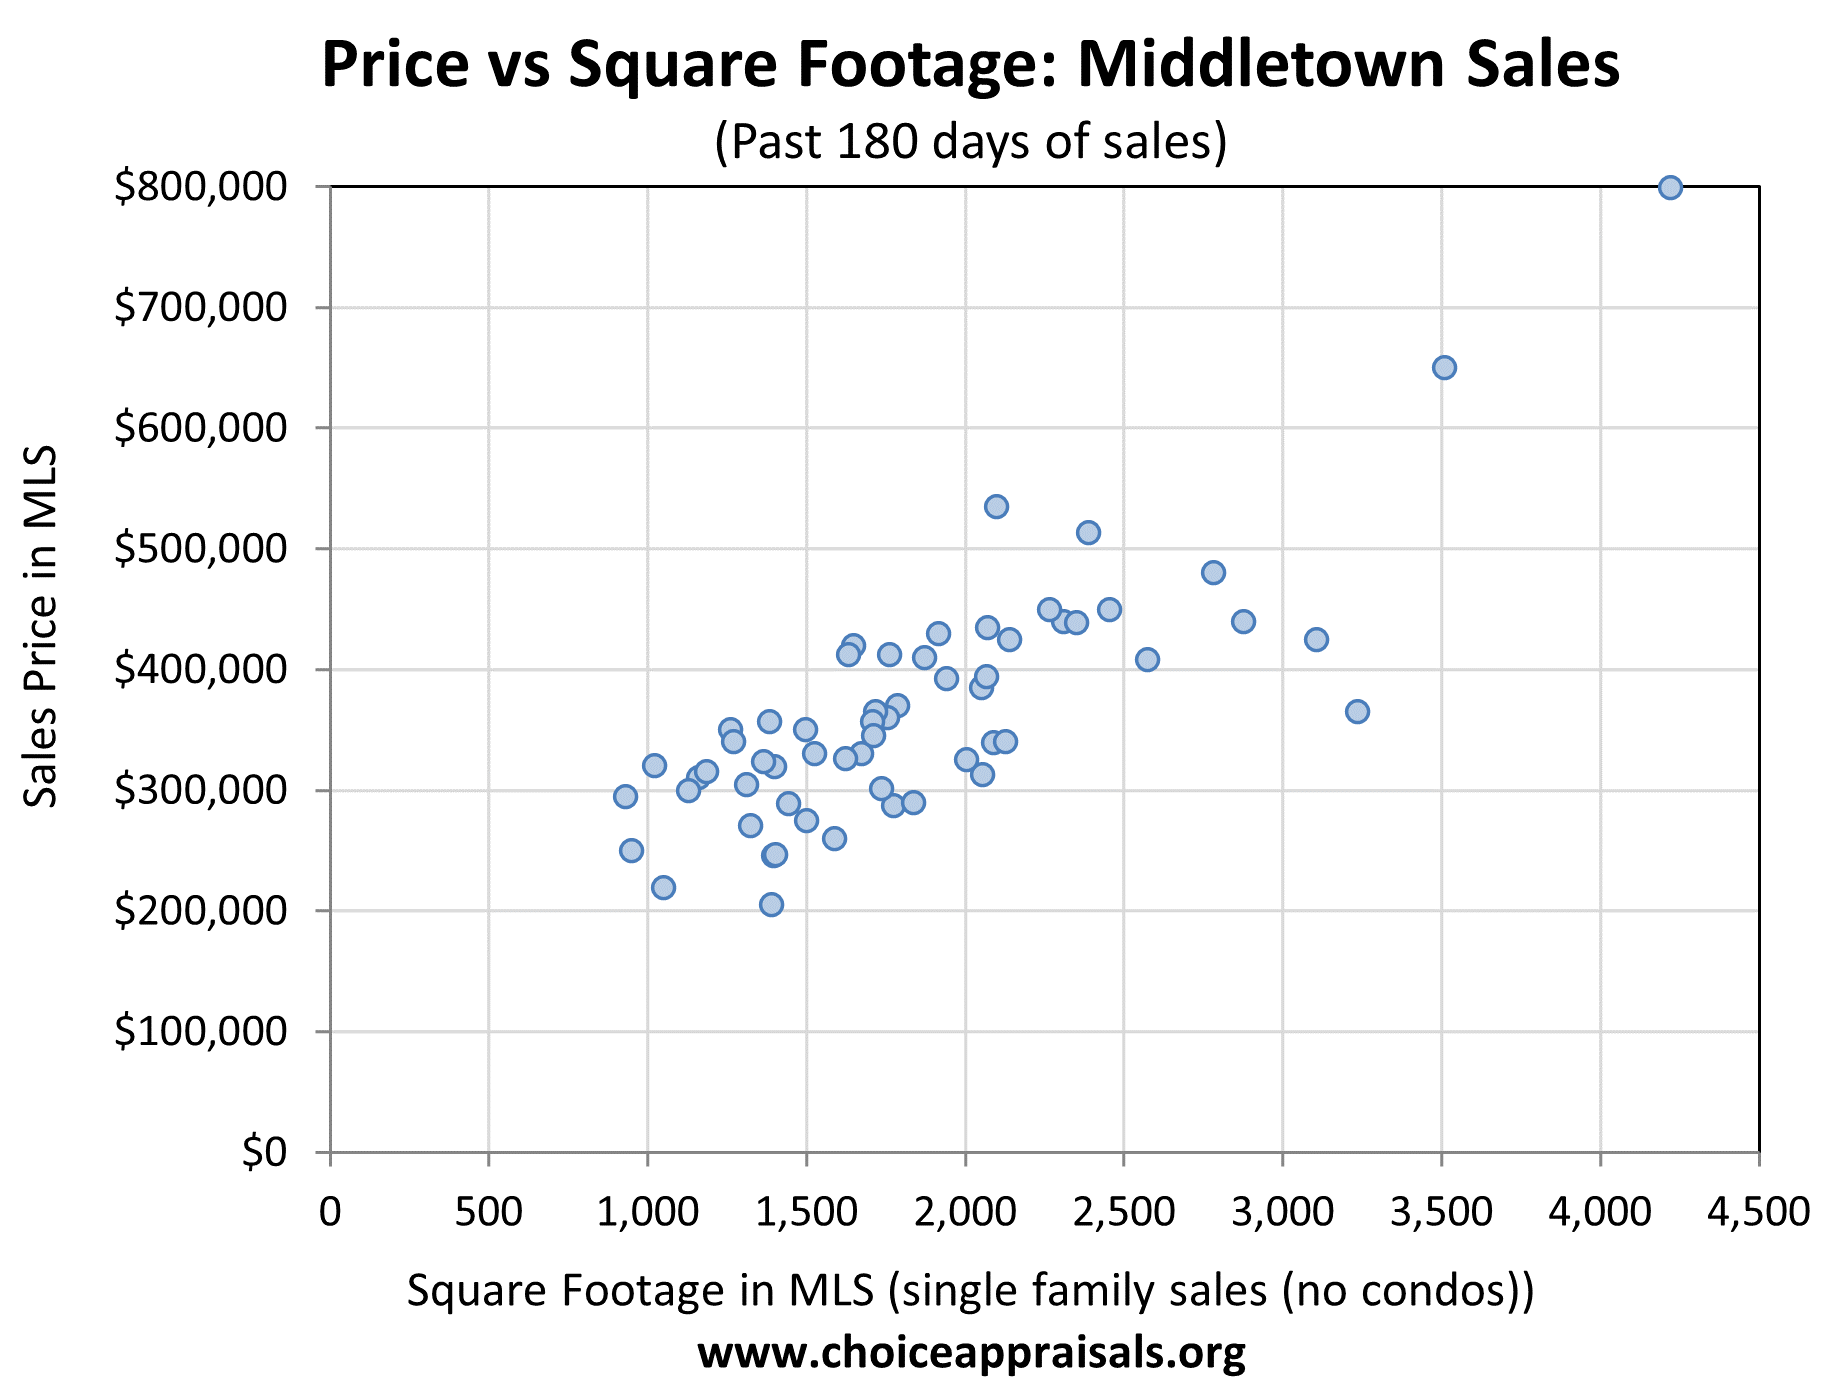
7. Price per Square Foot vs Bedroom Count: As expected, more bedrooms generally mean a higher price per square foot, yet there are outliers, suggesting that Middletown buyers value quality and features alongside size.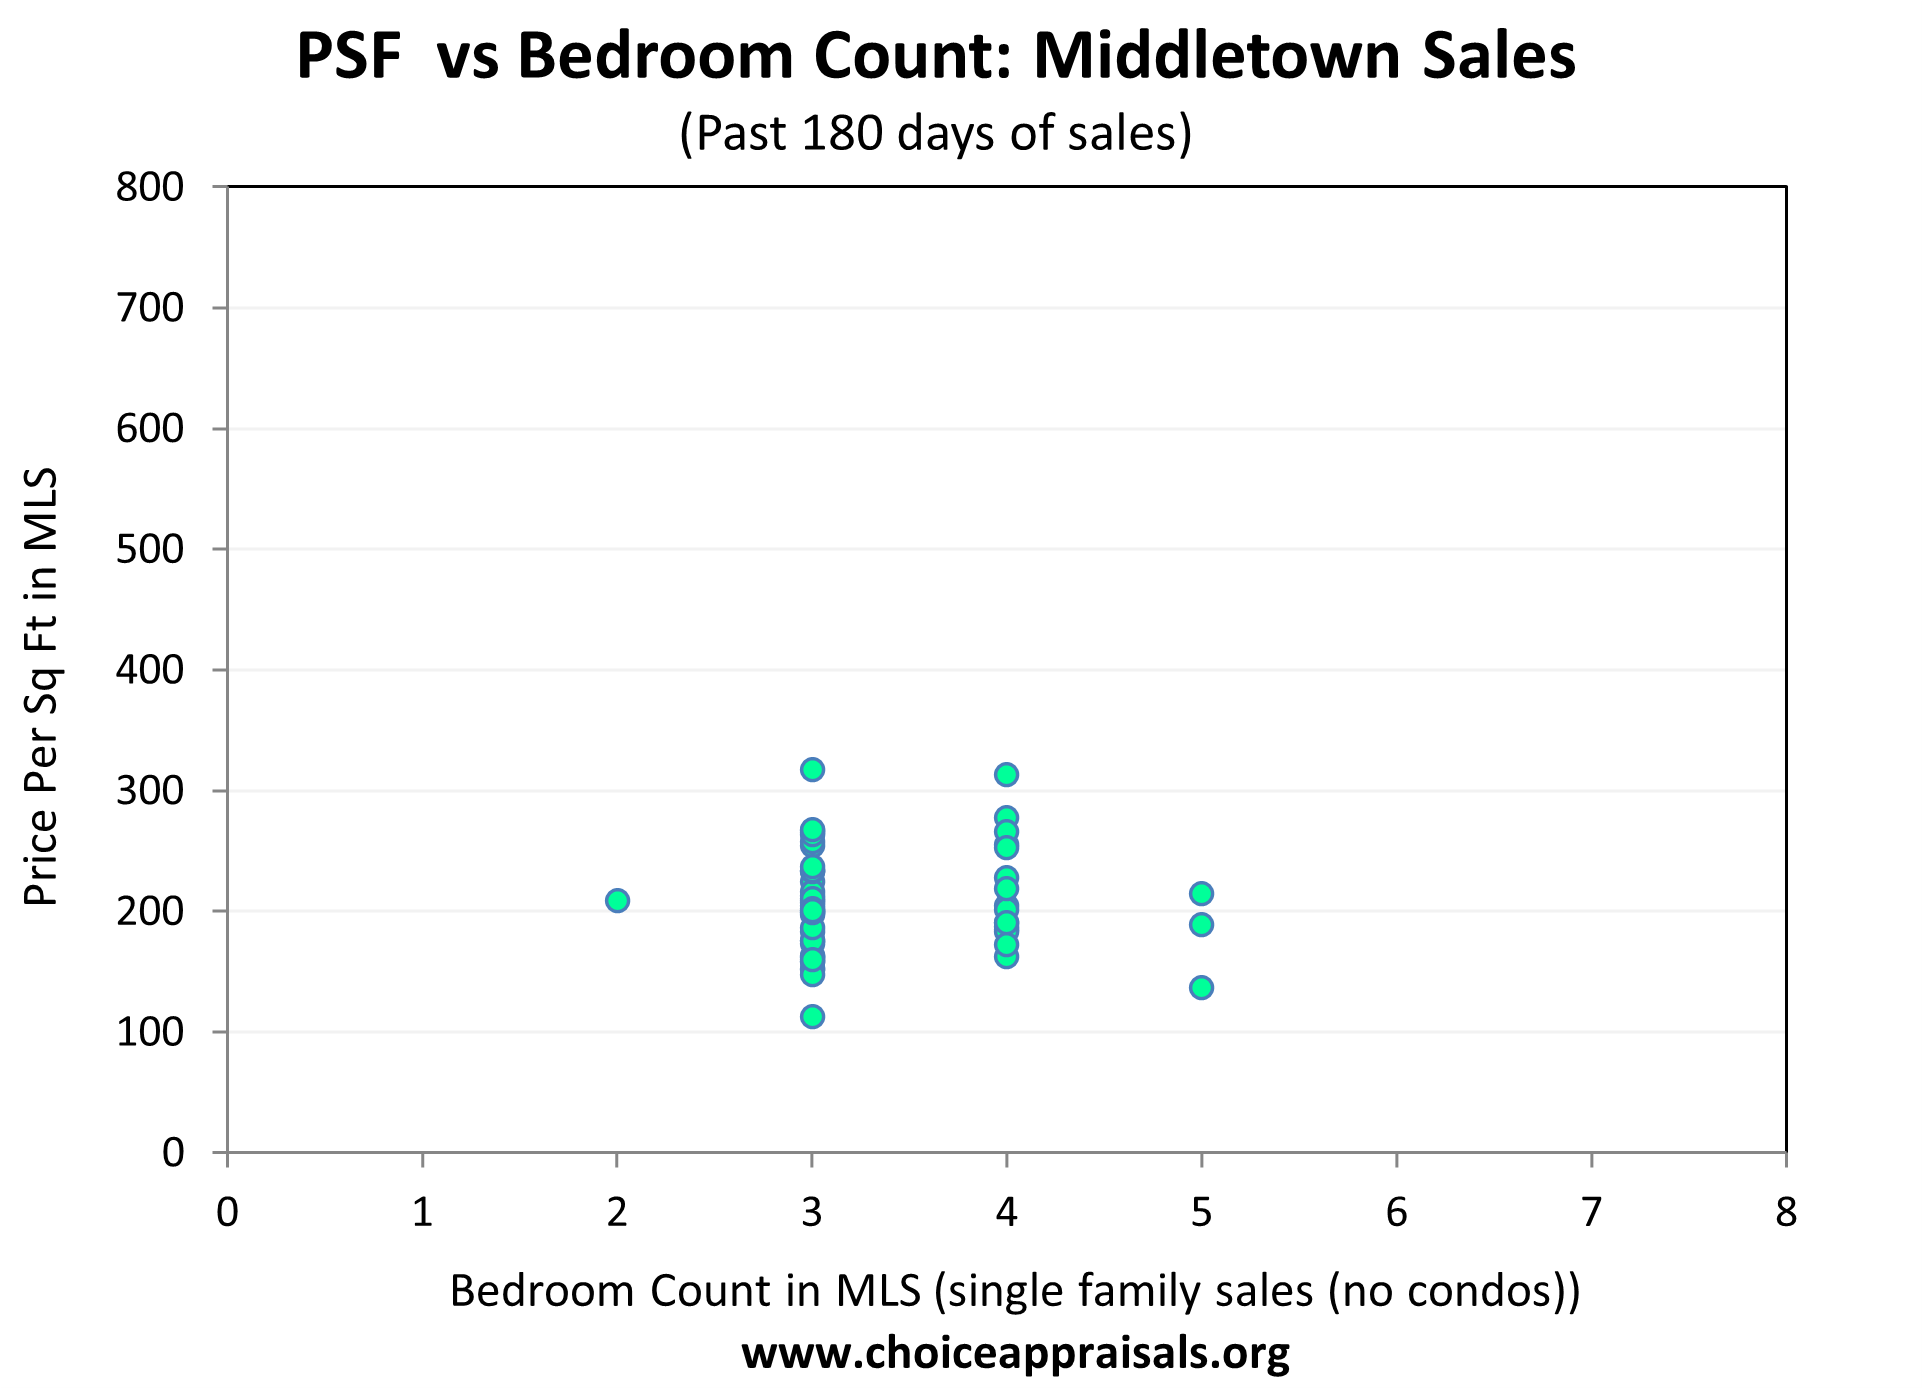
8. Sales Price Compared to Original Price (Dollar Amount): Most sales hover around the original list price. However, some are under the list .price, illustrating room for negotiation.
 9. Sales Price Compared to Original Price (Percentage): A similar trend as above, with sale prices closely aligned with list prices, affirming a market with a little room for price negotiation (but clearly not a lot).