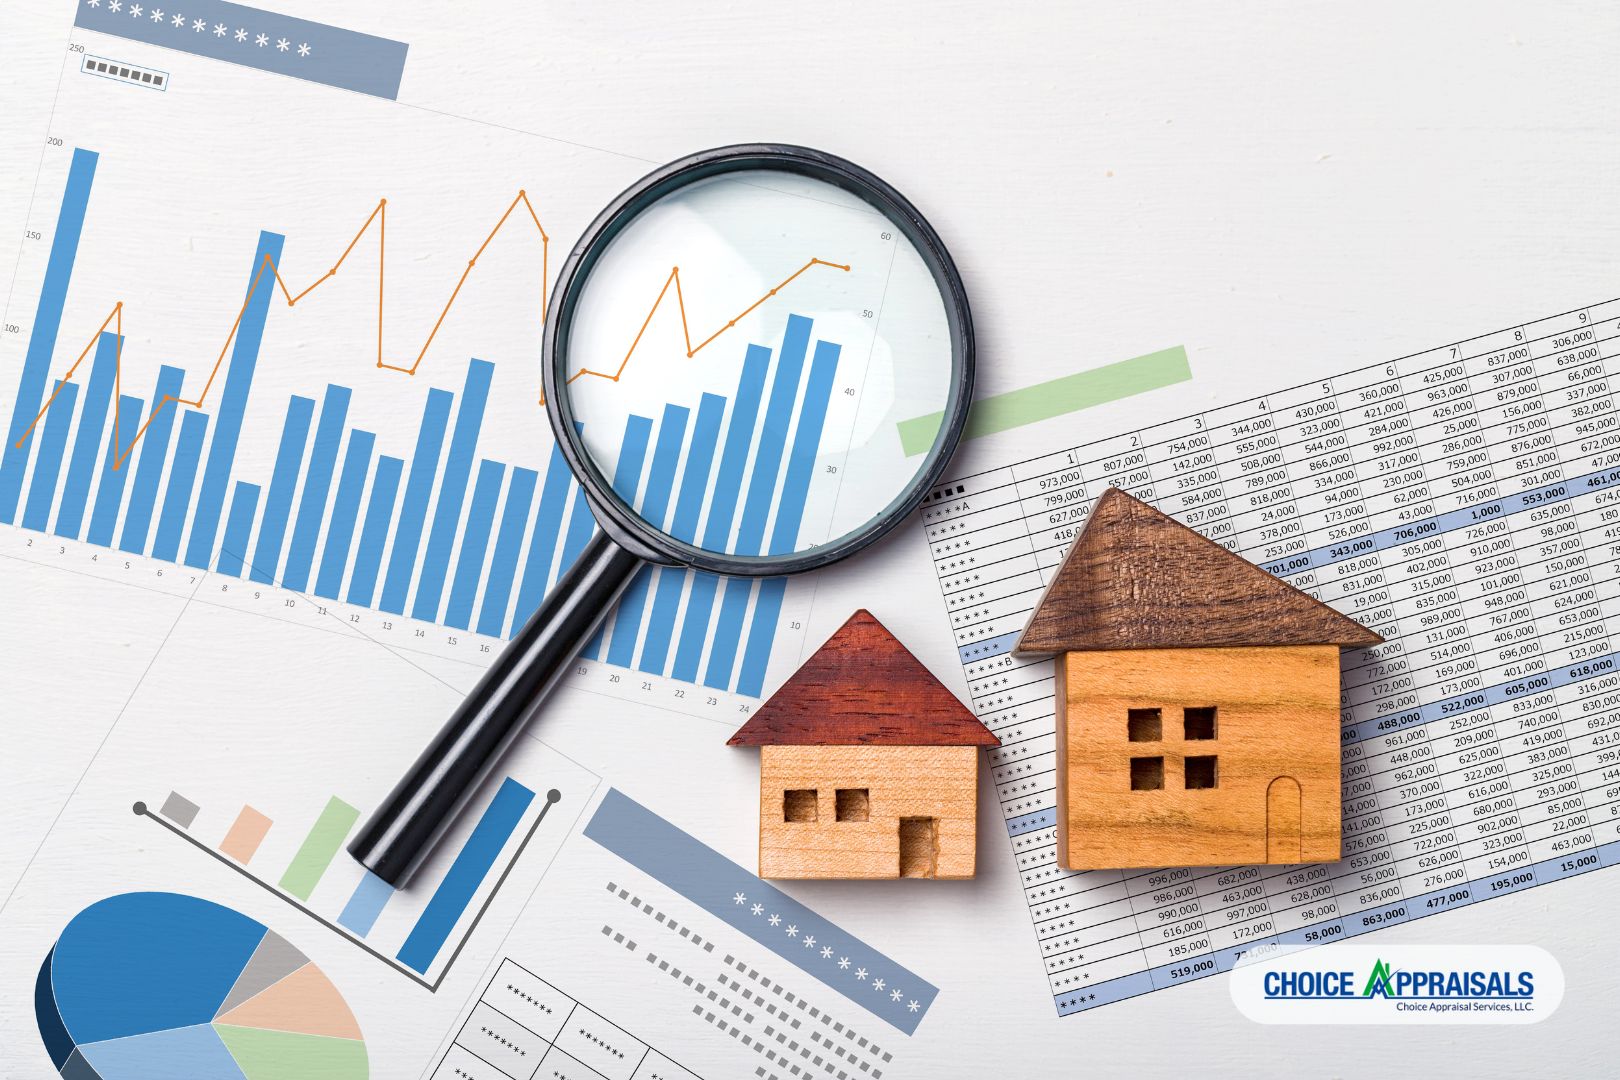
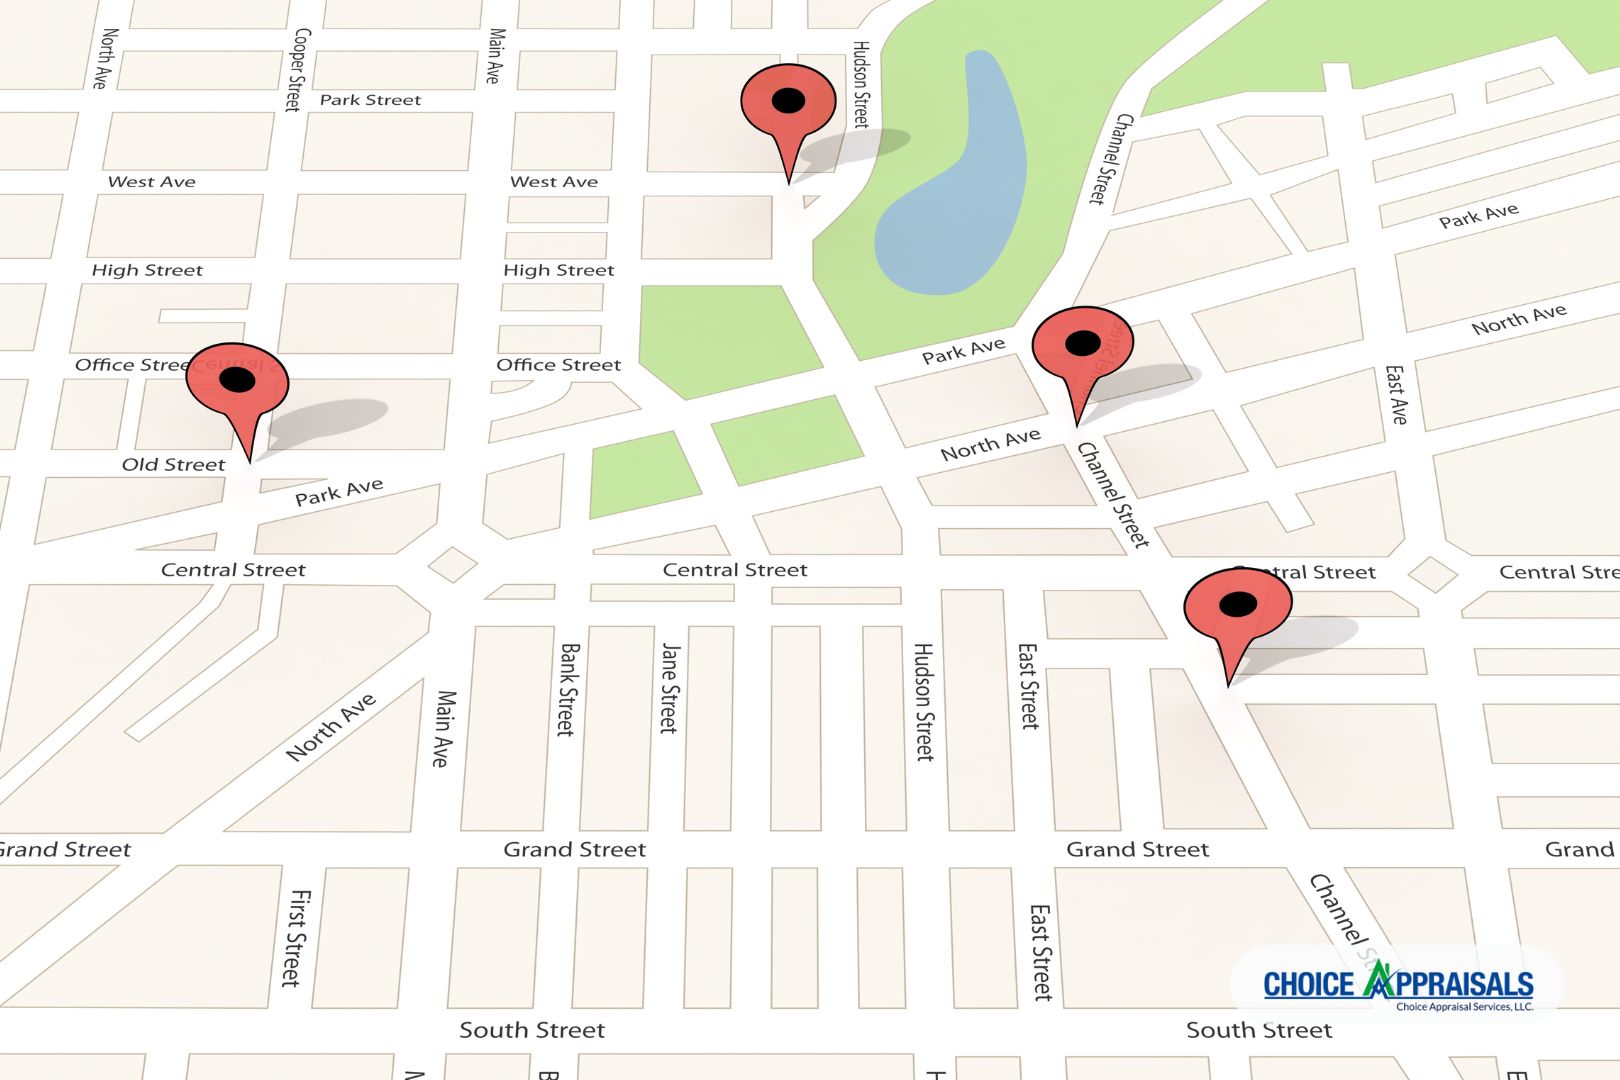
by Conrad Meertins | Nov 10, 2025 | Valuation

Every probate attorney has been there — waiting on an appraisal while the 90-day clock ticks and heirs get restless.
After handling over 120 estate appraisals across Kentucky, I’ve seen how one late or unclear report can derail an otherwise clean case.
You’ve filed the petition. The hearing is scheduled. Everything’s on track — until the appraisal disappears into a black hole for three weeks, and suddenly you’re the one fielding angry calls from beneficiaries who think you’re stalling.
This isn’t about real estate values. It’s about control, speed, and your client’s confidence in you.
When the appraisal process breaks down, your reputation takes the hit — not the appraiser’s.
The Real Problem: Appraisals That Create More Work
Most appraisers treat probate like any other assignment.
They don’t understand that your timeline isn’t a suggestion — it’s a court order with consequences.
Here’s what that looks like in practice:
- Missed deadlines that trigger show-cause orders or force continuances
- Radio silence that makes you look unresponsive when heirs call asking for updates
- Vague reports that spark disputes instead of settling them
- Inexperienced appraisers who need hand-holding, turning you into a project manager instead of an attorney
And when that happens, it’s not just a delay — it’s a credibility hit.
“If an appraiser disappears for a week, it’s the attorney’s reputation that takes the hit.”
You didn’t go to law school to babysit vendors. Yet here you are, chasing down someone who should be making your job easier.
The Fallout: When Client Trust Erodes

When an appraisal is late or unclear, heirs don’t call the appraiser — they call you.
Suddenly you’re managing family dynamics, mediating disputes over comparable sales, and burning billable hours explaining why a property is worth X instead of Y.
Every conflict costs you:
- Time you could spend on actual legal work
- Emotional energy managing irrational family drama
- Reputation as heirs wonder why this is taking so long
And the worst part? None of this is your fault — but it’s absolutely your problem.
The truth is, attorneys don’t want another appraisal. They want a fast, defensible, drama-free process that lets them stay in control.
What the Best Probate Attorneys Look For

After working with hundreds of estate cases, I’ve noticed the top-performing attorneys all use the same criteria when choosing appraisal partners:
1. Speed with substance
Fast turnaround that doesn’t sacrifice accuracy. Court deadlines matter, and a 3–5-day delivery window keeps cases moving while staying defensible.
2. Proactive communication
Updates before you have to ask. When you can tell heirs “the appraiser will be there Tuesday” instead of “I’m still waiting to hear back,” you control the narrative.
3. Court-ready clarity
Reports written so heirs understand them, judges approve them, and the IRS accepts them. Technical accuracy matters, but so does plain-English explanation that prevents disputes before they start.
4. Deep comparable analysis
20–30 sales analyzed, not three. When someone challenges the value (and someone always does), you need depth that holds up under scrutiny.
5. Probate-specific formatting
Reports structured for estate administration from day one — not generic lender templates you have to translate for court use.
“The right appraisal partner makes you look organized, professional, and in control — exactly the way your clients expect to see you.”
Three Questions to Ask Before Hiring Any Estate Appraiser

Before you bring an appraiser onto your next case, ask these three questions.
Their answers will tell you everything.
1. “What’s your average turnaround time for probate appraisals — and what causes delays?”
- Good answer: A specific timeline (3–7 days) with an honest discussion of what could slow things down (access issues, complex properties).
- Red flag: Vague promises or “it depends.”
2. “How many comparable sales do you typically analyze, and how do you explain valuation to heirs?”
- Good answer: 20+ comps with a clear explanation method. They should talk about plain-English summaries, not just technical reports.
- Red flag: “Whatever USPAP requires” or “3–5 comps.”
3. “How do you communicate updates to attorneys during the process?”
- Good answer: Proactive milestone updates via your preferred method. They should ask how you want to be updated.
- Red flag: “Call me if you need anything.” That makes you the project manager.
The best appraisers understand they’re not just valuing property. They’re protecting your timeline and your reputation.
The Bottom Line
You can’t control family dynamics. You can’t control court calendars.
But you can control who you trust with the appraisal process.
The goal isn’t just getting a number on a page. It’s protecting your timeline, your credibility, and your ability to focus on actual legal work instead of vendor management.
When the appraisal is handled right, heirs agree, judges approve, and you get back to practicing law — not playing referee.
Next Move:
Before your next estate case, run through those three questions with your appraiser.
Their answers will tell you instantly whether you’re dealing with a partner or a liability.
If this hit home, I’m happy to send over our Attorney Checklist for Vetting Estate Appraisers — the exact questions that separate pros from problems. Or, if you prefer a quick conversation, we can jump on a short call and I’ll walk you through how to use it. Either way, I hope this gave you something useful for your next estate case.
Conrad Meertins, Jr. is a certified residential appraiser specializing in probate and estate valuations. With over 867 estate appraisals completed and zero valuation disputes, he works exclusively with attorneys and personal representatives who need court-ready reports on compressed timelines.
by Conrad Meertins | Nov 3, 2025 | Uncategorized

You priced the listing based on solid comps. It showed well. You got an accepted offer. Then the appraisal came back short—and suddenly you’re managing a renegotiation, an angry seller, or a dead deal.
Sound familiar?
Here’s what most agents miss: your CMA and the appraiser’s analysis are based on different tools and standards. You’re both analyzing the market — but the appraiser’s opinion of value is based primarily on closed sales and adjustments supported by market data.
The gap between those two perspectives is where deals fall apart. After reviewing thousands of appraisals, I’ve identified the five blind spots that create that gap most often—and how to anticipate them before your next listing goes live.
Table of Contents
- Think Like an Appraiser: The Game Plan
- Blind Spot #1: Ignoring Functional Obsolescence
- Blind Spot #2: Overvaluing Cosmetic Upgrades
- Blind Spot #3: Misreading Market Movement
- Blind Spot #4: Ignoring Micro-Location Premiums
- Blind Spot #5: Not Partnering Early with an Appraiser
The Game Plan: Think Like an Appraiser

Appraisers don’t define “comparable” the way agents do. And that gap is where most pricing mistakes happen.
Here’s what agents often miss: appraisers weight factors based on what the market proves matters—not what agents assume matters. In some markets, square footage drives value. In others, views or condition dominate. The key: it’s always data-driven, never formulaic.
Most CMAs rely on recent sales and general proximity. Appraisers dig deeper—analyzing paired sales to quantify specific differences, reviewing buyer behavior patterns, and testing adjustments against actual market reactions.
Example: An agent might use a same-size home 0.5 miles away because it closed at a great price. An appraiser might reject it because it’s across a busy road or in a different school district—and comparable sales data proves buyers pay differently for those location factors.
The result? Your comp supports your price. The appraiser’s comp doesn’t. And your deal is now $40K underwater. Of course, that’s an over-simplification, but you get the idea.
A note on price per square foot: It’s not a value conclusion—it’s a supporting data point. Appraisers use it to test adjustments and spot trends, but never as a standalone indicator of value. A 1,200 sf home at $400/sf isn’t automatically worth more than a 2,400 sf home at $350/sf. Quality, location, and market-specific features determine value—the math just helps verify consistency.
Bottom line: If you’re not thinking about how the market actually reacts to specific property differences, you’re building your CMA on assumptions the appraiser can’t support.
Blind Spot #1: Ignoring Functional Obsolescence
Functional obsolescence is the valuation term for layouts that don’t work for today’s buyers. It’s not about ugly—it’s about inefficiency that the market penalizes.
Real example: A beautifully remodeled 1960s ranch with brand-new finishes appraised $25K lower than expected. Why? The layout featured four small shotgun bedrooms—each accessible only by walking through another—with no true primary suite and a kitchen cut off from the main living areas.
Despite the high-end materials, buyers consistently paid less for that kind of choppy, outdated layout. The closed sales made it clear: Gorgeous materials couldn’t fix a floor plan that comparable sales proved buyers avoided or paid less for.
Here’s the critical part: appraisers adjust for functional obsolescence when market data proves buyers paid less for inefficient layouts—not based on personal preference or design trends. If comparable sales show a measurable difference in price for similar square footage with better flow, the adjustment is supportable. If not, there’s no adjustment.
Walk the home like an appraiser, not a stager. Ask:
- Does the flow match how buyers live today?
- Is the primary suite competitive with other homes in this price range?
- Are there shotgun bedrooms?
- Do comparable sales show a price difference for these layout issues?
If the answer to that last question is yes, price accordingly. Buyers might fall in love anyway—but the appraiser won’t overlook what the market data reveals.
Blind Spot #2: Overvaluing Cosmetic Upgrades

Here’s the nuanced truth about upgrades: not all improvements add the same value, and market reaction varies by what buyers expect vs. what they reward.
Appraisers distinguish between updates that meet baseline expectations and those that create competitive advantages. A new roof or working HVAC system? Buyers expect those to function—they’re not paying premiums for them. But a thoughtfully updated kitchen with new countertops and backsplash? That can actually shift a home’s condition rating and create measurable market preference.
What often adds measurable value (when done well):
- Kitchen and bath updates that modernize dated spaces (countertops, backsplash, fixtures—especially when they transform the overall impression)
- Square footage additions (permitted)
- View premiums (when comparable sales support them)
- ADUs or income-generating features
- Finished basements or bonus spaces (in markets where this matters)
What typically doesn’t add much (buyers just expect it to work):
- New roof (prevents a deduction, rarely adds premium)
- HVAC replacement (maintenance, not value-add)
- Foundation repairs (fixes a problem, doesn’t create advantage)
- Energy efficiency upgrades (solar, high-efficiency systems—market reaction is inconsistent and often doesn’t match cost)
“A new roof doesn’t add $15K in value—it helps avoid a $15K hit from buyers discounting for deferred maintenance. But a refreshed kitchen can actually improve the home’s marketability and shift its competitive position.”
Here’s why kitchen updates can matter more than you’d think: When countertops and backsplash are part of a coordinated update (maybe paired with paint, hardware, and lighting), they can elevate a home from C4 (Average) to C3 (Average/Good) condition in the appraiser’s analysis. That condition rating shift affects which comparable sales are most relevant—and can support a higher value range.
If your seller just spent $50K on a new roof and HVAC, manage expectations: those updates make the home financeable and marketable, but they’re bringing it to baseline—not past it. If they spent $20K smartly updating the kitchen? That has a better chance of moving the value needle, because it changes how buyers (and appraisers) perceive the home’s competitive position.
The key: Appraisers adjust based on market reaction and condition assessment—not renovation cost or Instagram appeal.
Blind Spot #3: Misreading Market Movement
You’re analyzing current market momentum. Appraisers are verifying it with closed data.
When the market’s moving fast, this creates tension. You’re seeing pending offers at $650K. The appraiser is prioritizing closed sales from recent months at $610K. That $40K gap isn’t imaginary—but it needs to be supported with data, not just asserted based on current listings.
Here’s what many agents don’t realize: Appraisers can and do use pending sales and active listings to support market direction—especially in fast-moving markets. The difference is in how they’re analyzed. Pending sales need verification. Active listings show market expectations, not concluded transactions. Both can support time adjustments or market trend analysis when properly documented.
Here’s how to bridge the gap:
- Provide pending sales data with detail (if you have access to accepted offer prices and can verify terms)
- Include active listings to demonstrate where the market is heading (appraisers can use this to support directional trends)
- Supply market trend data (days on market, absorption rates, price movements by neighborhood or property type)
The key: don’t just show the appraiser what sold. Show them why the market shifted and provide data that supports the trend.
If you’re pricing in a rising market, document everything. Give the appraiser the market story backed by verifiable data—not just current enthusiasm.
And here’s the bottom line: however strong the market momentum, the appraised value still needs to be supported by at least one recent, closed sale that doesn’t require upward adjustment to reach the contract price. Pending and active listings can support a trend—but they can’t carry the value on their own.
Blind Spot #4: Ignoring Micro-Location Premiums
Two identical homes. Same square footage, same finishes, same school district. One backs open space. One backs a retail center parking lot.
The difference? $15,000.
Appraisers analyze micro-location factors that many agents treat as “intangibles”:
- View (mountains, water, open space vs. rooftops or parking lots)
- Orientation (southern exposure vs. northern)
- Traffic patterns (quiet cul-de-sac vs. busy collector road)
- Adjacent land use (greenbelt vs. power lines, parks vs. commercial)
These factors aren’t ignored—they’re adjusted for when market data supports them. An appraiser won’t add $50K for a view just because it’s desirable. They’ll add it because paired sales analysis or comparable sales prove buyers consistently paid a premium for it.
This is why comparable selection matters so much. If your comparable home backs open space and the subject backs a parking lot, that’s not an equal comparison—and appraisers will adjust for the difference if market data quantifies it.
The move: If your listing has a location advantage, identify comparable sales that prove the premium. If it has a disadvantage, find comparables that reflect the penalty and price accordingly. Don’t assume buyers will pay a premium the market data doesn’t support.
Blind Spot #5: Not Partnering Early with an Appraiser

Most agents call an appraiser after the deal is in trouble. Smart agents consult before the listing goes live.
A pre-listing valuation consultation gives you:
- Insight into potential valuation challenges before you commit to a price
- A clearer understanding of which upgrades or features the market actually rewards
- Protection against deal fallout later (you’ve already stress-tested the price against appraisal standards)
Important distinction: This isn’t a formal appraisal—it’s a consulting conversation. No value opinion is provided without a proper appraisal engagement. But the perspective can help you identify red flags early: functional issues the market penalizes, cosmetic upgrades that won’t move the needle, or comparable sales you might have missed.
Think of it as pricing insurance. You’re not guessing what the appraiser will conclude—you’re thinking through the valuation lens before you go live.
Here’s the move: Before your next listing appointment, walk the property with an appraiser’s perspective. Identify the functional issues, the upgrades that matter vs. those that don’t, the micro-location factors that create premiums or penalties. Then price based on what market data will support—not just what current buyer excitement suggests.
And if you’re not sure? Consult with an appraiser before you commit to a number.
Schedule a Pre-Listing Valuation Consultation →
(This is a consulting service—not a formal appraisal. It’s designed to help you identify potential valuation challenges before your listing goes live.)
The Bottom Line
Appraisers don’t kill deals. Unsupportable pricing does.
When you price with the valuation lens—understanding how appraisers analyze comparables, weight market data, and test assumptions—you’re not guessing. You’re building a price that can survive scrutiny.
The agents who master this? They’re the ones sellers trust, buyers respect, and other agents refer to. Because when the appraisal comes back, their deals close.
Next time you price a listing, ask yourself:
Can I support this number with market data an appraiser would find credible?
If you can’t back it up with data an appraiser would find credible, think twice before committing to the price.
by Conrad Meertins | Aug 4, 2025 | Uncategorized

Have you ever wondered how much a spacious backyard or a recently renovated kitchen adds to a property’s value? While only a licensed appraiser can determine a property’s appraised value, understanding how size and condition influence the process can help real estate agents guide clients—and help homeowners make informed decisions about improvements.
This article offers insight into the appraiser’s approach to these key valuation factors, so you can better anticipate what to expect during the appraisal process.
Why Size Matters in Property Valuation

The size of a property is a major factor in determining its value. Appraisers consider how the total gross living area (GLA) compares to similar properties, typically using standards like ANSI Z765 for measurement consistency. Larger homes often have a lower price-per-square-foot due to diminishing returns—each added square foot contributes less to overall value than the one before it.
For example, imagine two homes: one is 1,200 square feet and the other is 2,400. If the smaller home is valued at $300,000, the larger isn’t necessarily worth $600,000. It might be valued at $550,000 because the market doesn’t value extra space at a 1:1 ratio.
What This Means for Agents and Owners: If you’re helping price a home or evaluating renovations, remember that size matters—but how much it matters depends on the local market. Simply adding square footage doesn’t guarantee an equal return in appraised value.
Evaluating Property Condition

Condition is another critical element. Appraisers look at the property’s overall upkeep, including both cosmetic finishes and major systems like roofing, HVAC, plumbing, and electrical. A home in excellent condition with modern updates typically earns a higher market value than a similar home in poor condition.
For instance, energy-efficient windows, a new roof, or a remodeled kitchen can positively influence value—but only if those features align with what buyers in that market are paying more for.
What This Means for Agents and Owners: Updates don’t automatically increase value. Agents should be prepared to discuss condition with sellers in relation to comparable homes in the neighborhood. Homeowners should know that quality upgrades can improve marketability, but appraisers base adjustments on what similar homes have actually sold for.
The Combined Impact of Size and Condition

Appraisers evaluate size and condition together, not in isolation. For example, a large home in poor condition may appraise lower than a smaller home in excellent shape. The context of the local market and buyer demand is key.
Appraisers use techniques like paired sales analysis—comparing similar homes with one key difference—to isolate the value of features like square footage or renovated kitchens. Adjustments aren’t based on set formulas but rather on what the market data supports.
What This Means for Agents and Owners: Agents can better advise clients by understanding that appraisers make value adjustments based on how buyers perceive features in the current market. Homeowners planning upgrades should focus on improvements that are both functional and consistent with neighborhood expectations.
Conclusion
Understanding how appraisers evaluate home size and condition helps demystify a process that can feel opaque. For agents, this knowledge supports better pricing strategies and stronger transactions. For homeowners, it means making informed renovation decisions and having realistic expectations.
Keep in mind: every appraisal is unique, and no single feature guarantees a specific value. The market—not opinion—drives valuation.
Disclaimer: The insights shared in this article are meant to help agents and homeowners understand general appraisal concepts. Only a licensed or certified appraiser can develop or communicate an opinion of value in compliance with the Uniform Standards of Professional Appraisal Practice (USPAP).
by Conrad Meertins | May 5, 2025 | Uncategorized
The world of real estate appraisal can be complex, especially when it comes to understanding adjustments and why cost per square foot (SF) doesn’t always provide an accurate picture. This article aims to shed light on these concepts, with a particular focus on the real estate market in Louisville, KY.
Introduction
Stepping into the world of real estate, you quickly realize it’s not as simple as buying low and selling high. There’s a science, an art if you will, to understanding property values. This is where the concepts of appraisal adjustments and cost per square foot (SF) come into play.
Appraisal adjustments and cost per SF are like the yin and yang of property valuation. They directly impact how much money changes hands in a real estate transaction. Whether you’re a buyer, a seller, an investor, or a real estate professional, understanding these concepts can mean the difference between a successful deal and a costly mistake.
But here’s the kicker: cost per SF, despite its widespread use, doesn’t always paint the full picture. And that’s where appraisal adjustments step in, fine-tuning the value to ensure it reflects the property’s true worth.
The Concept of Appraisal Adjustments

In the realm of real estate, adjustments are the bread and butter of accurate appraisals. Picture this: You’re comparing two houses. Both have the same square footage, the same number of rooms, and they’re in the same neighborhood. But one has a newly renovated kitchen, and the other doesn’t. Does the shiny new kitchen add value? You bet it does. This added value is what we call an “adjustment.”
Adjustments are changes made to the value of a property to account for differences between it and a comparable property. These differences could be anything — from a renovated kitchen to a swimming pool, or even the proximity to a popular school. In essence, adjustments allow appraisers to compare apples to apples when looking at different properties.
Numerous factors can prompt an adjustment — the property’s location, its condition, the size, the number of rooms, and any unique features it may have. The art of making adjustments is a delicate one. It’s not just about assigning value to individual features; it’s about understanding how all these features come together to influence a property’s overall appeal and market value.
Cost per SF: A Common Misconception
Cost per square foot (SF) is calculated by dividing the total cost of a property by its square footage. It’s commonly used because of its simplicity and its ability to provide a quick comparison between different properties. It’s like saying, “Hey, this apple and this orange are both fruits, so let’s compare them based on their weight.” But as we all know, there’s a lot more to properties than just their size.
A critical issue often overlooked is that even within the same neighborhood, cost per SF can be deeply misleading. Realtors frequently cite average cost per SF for a neighborhood as if it’s a uniform standard, but this practice glosses over significant variations between individual properties. Two homes on the same street with identical square footage can legitimately have vastly different values due to lot size, property condition, updates, layout efficiency, and architectural design.
Consider two 2,000 SF homes in Louisville’s Parkway Village neighborhood. One features an efficient floor plan with a modern kitchen, updated bathrooms, and a finished basement. The other has an awkward layout with wasted space, dated fixtures, and foundation issues. Despite sharing the same square footage and neighborhood, these homes should command significantly different prices. Yet cost per SF calculations would suggest they’re equivalent.
When Cost per SF IS Useful
To be fair, cost per SF does have legitimate applications in real estate. It’s particularly valuable in these scenarios:
- New Construction: When builders are estimating costs or pricing similar models in a new development, cost per SF provides a reasonable starting point since construction materials and labor represent a standardized expense.
- Condominiums: In buildings where units have similar finishes, amenities, and views, cost per SF can be more reliable since many variables are controlled.
- Commercial Real Estate: Office buildings, retail spaces, and industrial properties are often valued primarily on their income potential relative to their usable square footage.
- Market Trend Analysis: Looking at average cost per SF changes over time can help identify neighborhood appreciation trends, even if individual properties vary significantly.
- Initial Budget Planning: For buyers establishing a general budget range, neighborhood cost per SF averages can provide a starting reference point.
However, even in these cases, cost per SF should be just one tool among many – not the definitive measure of value.
Why? Cost per SF doesn’t account for the nuances that make each property unique. It overlooks factors such as location, age, condition, design, and the quality of construction, among others. It’s a one-size-fits-all approach in a world where every property is different.
For another example, imagine two properties in Louisville, KY, each with 2,000 SF of space. One is a newly built luxury condo downtown with high-end finishes, while the other is a 30-year-old suburban home needing significant updates. Using cost per SF, these two properties would appear equal. But are they really? Of course not.
That’s the limitation of cost per SF in appraisals. It’s a blunt instrument in a field that requires a scalpel’s precision. It overlooks the nuances that can significantly impact a property’s value, particularly in diverse real estate markets like Louisville, KY.
So, while cost per SF can give you a starting point, it’s just that — a start. To get an accurate appraisal, you need to dig deeper and consider the unique factors that make each property tick.
The Role of Adjustments in Accurate Appraisals

Adjustments are like the fine-tuning knobs on a vintage radio. They help us dial in the right frequency, or in this case, the most accurate property value.
In essence, adjustments account for differences between the subject property and the comparable properties. These differences could range from physical characteristics like the number of bedrooms, age, and size, to location-related aspects like proximity to amenities or quality of schools. Even factors like the condition of the property, or its appeal in the current market trends, can play a role.
Imagine you’re comparing properties in Louisville’s Highlands neighborhood. Your subject property is a charming 2-bedroom bungalow with a no basement, while a comparable property nearby is similar in many ways but features an additional bedroom and a finished basement. In this case, a downward adjustment would be made to the value of the comparable property to account for these differences.
The process of making adjustments is both an art and a science. It requires a combination of market knowledge, analytical skills, and sometimes, a bit of intuition. But when done correctly, adjustments can bring us closer to an accurate appraisal, helping both buyers and sellers make informed decisions.
The Importance of Accurate Appraisals

An inaccurate appraisal can have serious implications. It can skew the perception of a property’s value, leading to either overpricing or underpricing. This can result in a seller losing out on potential profit, or a buyer overpaying for a property. In a worst-case scenario, it can even derail a transaction entirely.
Consider this scenario: you’re selling a historic home in Crescent Hill, and the appraisal comes in significantly lower than your asking price because the appraiser didn’t properly account for the property’s unique architectural features and prime location. The buyer’s mortgage lender isn’t willing to loan more than the appraised value, and the buyer can’t make up the difference. The deal falls through, leaving you back at square one.
Now, let’s flip the script. You’re buying a new construction property in Norton Commons, and the appraisal comes in suspiciously high. Overjoyed at the apparent instant equity, you proceed with the purchase, only to find out later that comparable homes in the area are selling for much less. The feeling of being short-changed is not a pleasant one.
These scenarios underscore the importance of accurate appraisals in the real estate transaction process. They’re not just numbers, but critical tools that help ensure a fair and equitable exchange of properties. They provide a reliable basis for negotiation between buyers and sellers and give lenders the confidence to provide financing.
Conclusion
We’ve journeyed through the intricate world of real estate appraisal, dissecting the often misunderstood concepts of appraisal adjustments and cost per SF.
Remember, cost per SF, while popular, has both uses and limitations. It serves well in specific contexts like new construction, condominiums, commercial real estate, and broad market analysis. However, it falls short when used as the primary valuation tool for individual residential properties, especially when comparing homes within the same neighborhood that have different characteristics, conditions, and features.
It’s especially problematic when realtors and buyers use it to compare dissimilar properties, falsely assuming that similar locations and similar square footage should equate to similar values. The reality is far more complex, with each property possessing unique characteristics that can dramatically affect its true market value.
Appraisal adjustments take these variables into account. They’re the magnifying glass that lets us see the finer details, providing a more accurate appraisal. It’s a complex process, but it’s necessary for fair and equitable real estate transactions.
Whether you’re a seasoned real estate professional or a novice investor, understanding these concepts is vital. It’s like being handed a compass in the middle of the labyrinth — it’ll help you navigate the market with confidence and make informed decisions.
In the end, the goal is to ensure that every real estate transaction is a fair one. And for that, accurate appraisal adjustments are key.
To learn more about the methods I use to ensure accurate appraisals in Louisville KY. Please feel free to reach out to me via email.
by Conrad Meertins | Jan 20, 2025 | Valuation
My first experience with an ADU was about a decade ago in Old Louisville. It was a four-story single-family residence (a beautiful brownstone). Just as I thought I had finished the appraisal, the owner asked, “Would you like to see the carriage house?”
I didn’t know there was more to see, but I confidently said, “Of course!” I was looking forward to it, not realizing at the time how ADUs would eventually become a significant trend in real estate.
As a Louisville appraiser, I’ve witnessed firsthand how Accessory Dwelling Units (ADUs) are reshaping our local real estate market. From the historic carriage houses in Old Louisville to newly constructed garden suites in St. Matthews, these versatile spaces are becoming increasingly valuable additions to Kentucky properties.
Let’s explore how ADUs impact market value, both positively and negatively, and what homeowners and buyers need to know about Fannie Mae’s guidelines.
The Upside: Positive Impacts of ADUs on Market Value

1. Increased Property Value in Our Market
Here in Louisville, where housing demand continues to grow, particularly in areas like the Highlands and Crescent Hill, ADUs often significantly increase a property’s value. The charm of our historic neighborhoods makes these additions especially appealing when they complement the architectural character of the main residence.
2. Rental Income Potential in Derby City
With the Kentucky Derby, Louisville’s growing tourism industry, and our expanding medical district, ADUs offer unique rental opportunities. From short-term rentals during major events to long-term leases for medical residents and students, ADUs can provide substantial income streams that help offset mortgage costs or generate additional cash flow.
3. Enhanced Market Appeal in Our Community
Louisville’s multi-generational families and young professionals are increasingly seeking properties with ADUs. Whether it’s housing aging parents in Cherokee Gardens or creating a home office in Clifton, these spaces offer the flexibility and versatility that our local market demands.
4. Flexibility in Use
ADUs can adapt to the changing needs of homeowners. Today, they might serve as a rental unit or guest house; tomorrow, they could be a home office, a space for aging relatives, or even a short-term rental during Derby week.
Challenges to Consider: The Downsides of ADUs

While ADUs offer incredible benefits, there are challenges to keep in mind:
1. High Construction Costs
Building an ADU can be a significant upfront investment, ranging from $100,000 to over $400,000 depending on size, design, and location.
2. Zoning and Regulatory Hurdles
Local zoning laws and permitting requirements can be complicated. Noncompliant or illegal ADUs may impact insurance claims, property marketability, or financing options.
3. Increased Property Taxes
Adding an ADU typically increases a property’s assessed value, which means higher property taxes.
4. Maintenance and Management
For those renting out their ADU, property management and maintenance become ongoing responsibilities.
5. Type of ADU Impacts Value Differently
- Detached ADUs generally add the most value.
- Attached ADUs come next.
- Internal ADUs (like basement apartments) add the least value but can still be significant depending on the market.
What Does Fannie Mae Say About ADUs?

As a key player in the mortgage market, Fannie Mae provides specific guidelines for properties with ADUs:
- Appraisal Requirements: Appraisers must evaluate how the ADU contributes to market value by analyzing comparable sales or, if none are available, using a cost-based approach.
- Gross Living Area (GLA): ADUs are appraised separately from the main dwelling unless they are within it and have interior access.
- Legal Compliance: ADUs must meet local zoning laws and regulations to be included in the property’s valuation.
- Financing and Underwriting: Lenders must follow specific loan-to-value (LTV) and debt-to-income (DTI) guidelines while factoring in potential rental income from the ADU.
Real-Life Insights: ADUs in Louisville
My most recent experience with an ADU involved a proposed construction project—a $1.3 million build featuring a 3,500-square-foot main residence with an attached garage and a 1,500-square-foot ADU on the other side of the garage.
The design was not only stunning but also supported by the local market, demonstrating a positive correlation between construction costs and property value in this case.
Looking Forward: What ADUs Mean for Louisville

As Louisville continues to grow and evolve, ADUs represent a significant opportunity for property owners. Whether you’re in the Highlands, Butchertown, or the expanding East End, understanding how these units impact property values is crucial for making informed real estate decisions.
Adding an ADU can increase property value, generate income, and provide flexibility, but it also requires careful planning, compliance with local regulations, and a clear understanding of market trends.
Fannie Mae’s guidelines play a vital role in shaping how ADUs are appraised and financed, so it’s important to factor these into your decision-making process.
If you’re considering adding an ADU to your property—or buying a home with one—consulting with a professional appraiser who understands the local market can make all the difference.
Need professional guidance on ADU appraisal in Louisville? Contact me for a thorough valuation of your property’s potential!
by Conrad Meertins | Jan 13, 2025 | Uncategorized
In the world of real estate, few topics generate more discussion and debate than property appraisals. As a crucial component of nearly every real estate transaction, understanding how appraisers actually use comparables (or “comps”) can make the difference between a smooth closing and a deal-breaking surprise. Let’s pull back the curtain on this often misunderstood process.
Beyond the “Closest House” Myth
One of the most persistent myths in real estate is that the house down the street is automatically the best comparable. While proximity matters, it’s just one piece of a complex puzzle. Professional appraisers consider numerous factors when selecting comparables:
Market timing is crucial – a sale from six months ago might be less relevant than a similar property that sold last month in a neighboring community, especially in rapidly changing markets. The goal is to capture the most accurate snapshot of current market conditions, not simply find the closest properties.
Consider this: A colonial-style home with premium finishes might have more in common with a similar property half a mile away than with the ranch-style house next door, even if they share the same square footage. Professional appraisers understand these nuances and select comparables that truly reflect the subject property’s characteristics.
The Science Behind Adjustments

Contrary to popular belief, appraisal adjustments aren’t arbitrary numbers pulled from thin air. They’re based on detailed market analysis and documented evidence. Here’s how it really works:
Appraisers use paired sales analysis to isolate the value of specific features. By comparing similar homes where one has a particular feature (like a finished basement) and one doesn’t, they can determine the market’s actual response to that feature. This method provides concrete evidence for adjustments rather than relying on construction costs or personal opinion.
Let’s look at some real market data from our downtown area that demonstrates how adjustments are determined:
Real Market Data: Bedroom Count Impact
Recent market analysis reveals clear value differences based on bedroom count and their corresponding median sales price (keep in mind this data for one specific market area as of this month:
- 2 bedrooms: $116,500
- 3 bedrooms: $151,000
- 4 bedrooms: $169,000
This data tells us that the market values the difference between a 2-bedroom and 3-bedroom home at approximately $34,500, while the jump from 3 to 4 bedrooms adds about $18,000 in value. When appraisers make bedroom count adjustments, they use this type of market-derived data rather than arbitrary figures.
Real Market Data: Basement Configuration
The market also shows clear preferences for different basement types:
- No basement: $115,000
- Interior access only: $146,300
- Outside entry: $160,000
This data indicates that adding a basement with outside entry adds about $45,000 to a home’s value compared to no basement, while an interior-access-only basement adds approximately $31,300. These are the kinds of concrete market differences that inform adjustment decisions.
Why Your Renovation Might Not “Add Up”

One of the most challenging conversations in real estate is explaining why a $50,000 kitchen renovation might not result in a $50,000 increase in appraised value. The reason lies in how markets actually respond to improvements:
Markets often recognize value differently than construction costs. While a high-end kitchen renovation might cost $50,000, if similar homes in the area typically sell for only $25,000 more with updated kitchens, that’s what the market is willing to pay. Appraisers must reflect this market reality in their adjustments, regardless of actual improvement costs.
The Role of Market Conditions

Time adjustments are perhaps the most misunderstood aspect of the appraisal process. In rapidly changing markets, even sales from three months ago might need significant adjustments to reflect current conditions. These adjustments are based on documented market trends, not guesswork.
For example, if market analysis shows home values in an area have appreciated by 1% per month, a comparable sale from four months ago would need a 4% upward adjustment to reflect current market conditions. This systematic approach ensures that older sales remain relevant while accounting for market changes.
Professional Judgment in Context

While appraisal adjustments are data-driven, professional judgment still plays a vital role. The key is understanding where and how this judgment is applied:
Appraisers must weigh competing factors, such as whether to use an older sale that’s very similar to the subject property or a more recent sale that requires larger adjustments. These decisions are guided by professional standards and market evidence, not personal preference.
Working Together for Better Outcomes

For real estate professionals and homeowners alike, understanding the appraisal adjustment process leads to better outcomes. Here’s how you can help:
- Maintain detailed records of improvements, including dates and costs
- Document any unique features or recent updates that might not be visible during inspection
- Provide information about recent changes in the neighborhood that might affect value
- Be prepared to share information about any previous offers or market exposure
The Bottom Line
The appraisal adjustment process is far more rigorous and market-based than many realize. While it may sometimes deliver unexpected results, understanding how comparables are really used can help all parties navigate the process more effectively.
Remember: The goal of an appraisal is not to hit a predetermined number but to provide an objective opinion of value based on market evidence. When all parties understand this fundamental truth, we can work together more effectively to facilitate successful real estate transactions.
by Conrad Meertins | Jan 6, 2025 | Uncategorized

Is spring really the best time for a home appraisal, or is it just a myth? While many assume that spring and summer are ideal seasons due to curb appeal and heightened real estate activity, the reality is far more nuanced. This post will help separate fact from fiction, offering practical insights into the optimal timing for an appraisal.
Seasonal Impact on Appraisals
Increased Sales Data
Spring and summer often see a higher volume of real estate transactions, providing appraisers with more recent and relevant comparable sales data. This increased data can lead to more robust market analyses, but it doesn’t guarantee higher property values.
Market Activity Levels
Heightened buyer demand during spring and summer can drive up sales prices, reflecting a more competitive market. However, more activity also means more properties, including lower-value ones, which may temper average price gains.
Supply and Demand Shifts
While buyer demand can push prices higher, an influx of listings can balance or even suppress those gains. Think of it as a balancing act: a hot market doesn’t always translate to higher valuations if supply meets or exceeds demand.
Timelines and Appraisal Volume
Peak seasons mean busier appraisers, which can lead to longer turnaround times. If you’re on a tight schedule, consider booking your appraisal early to avoid delays.
Seasonal Appeal
Spring and summer may show your property at its best—lush landscaping, bright interiors, and improved curb appeal can positively influence a buyer’s impression. However, appraisers rely on market data and property condition over aesthetics, ensuring a balanced valuation.
Why Waiting Might Not Guarantee a Higher Appraisal

Market Dynamics Can Vary
Property values depend on current market trends, not just the season. For instance, rising interest rates in summer might offset increased demand, stabilizing or even lowering home prices.
Comparable Sales Adjustments
Appraisers adjust for market timing. If comparable sales from a busy season reflect higher prices, these will be factored into the appraisal even if your property is assessed in an off-season.
Seasonal Competition
A busy market can lead to more listings, creating competition that tempers price increases. Conversely, reduced competition in slower months might work in your favor.
Current Market Trends
Local markets are highly variable. Broader seasonal patterns might not align with trends in your area, making it essential to focus on regional conditions rather than national expectations.
The Importance of Current Market Conditions

Timely and Reliable Appraisals
Appraisals reflect a property’s value at the time they’re conducted, offering a snapshot based on market conditions. Waiting for a specific season can delay your plans and may not result in higher valuations.
Actionable Insights
Scheduling an appraisal now ensures you have the most current data, helping you make informed decisions, whether for a sale, refinancing, or tax appeal.
Professional Objectivity
Appraisers are trained to account for market variables and timing, ensuring an unbiased and accurate valuation regardless of the season.
The Bottom Line
While spring and summer may offer more comparable sales data and aesthetic appeal, they don’t guarantee higher appraised values. Factors like market demand, supply, and broader economic conditions have a greater impact on property value.
Here’s the key takeaway: the best time for a home appraisal is when you need it. Whether it’s summer or winter, a well-maintained property will reflect its true market value, thanks to the expertise of a professional appraiser.
Thinking about getting a home appraisal? Give me a call today to gain a clear understanding of your property’s value in the current market. Don’t wait for the “perfect” season—schedule your appraisal when it aligns with your goals.
by Conrad Meertins | Dec 30, 2024 | Valuation

So, you’re a real estate professional, right? You’re no stranger to appraisal reports. They’re part of your daily grind. But let’s be real, these documents can sometimes feel like they’re written in a different language. How can you crack the code to understanding them better? That’s what this article is all about.
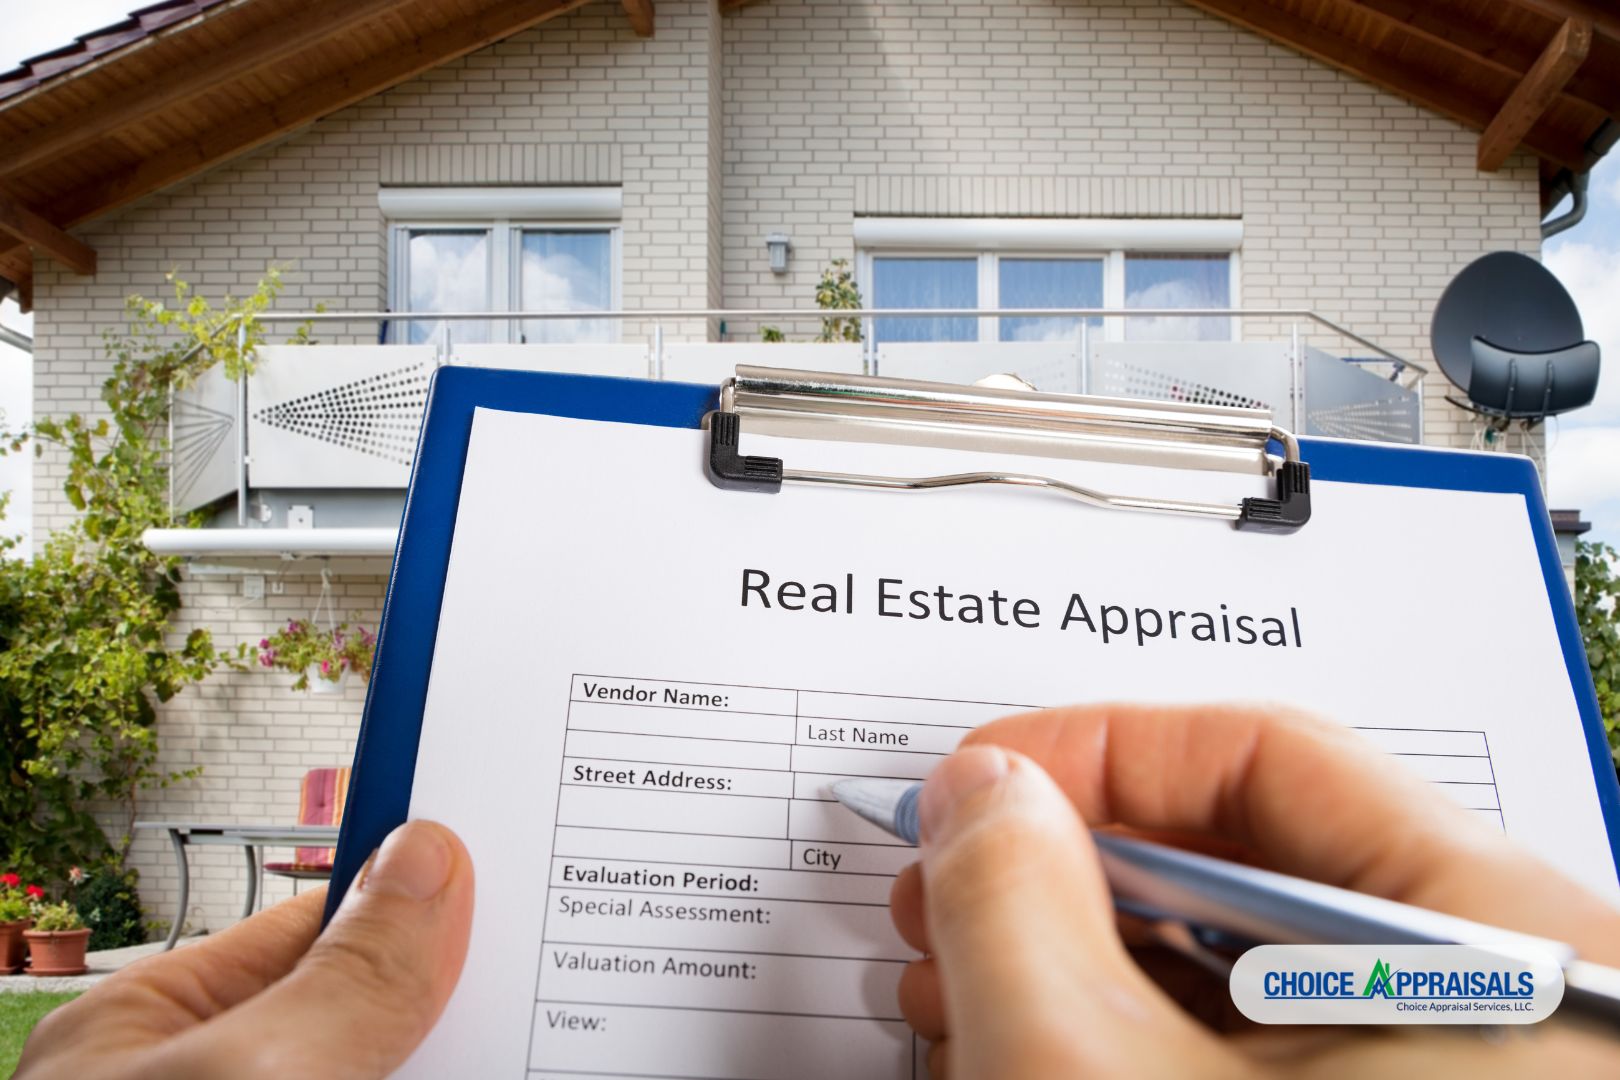
An appraisal report, in its simplest form, is an unbiased estimate of the value of a property. It’s an essential tool for lenders, buyers, and yes, agents like you. Why? Because it provides a defensible opinion of market value of a property, which is crucial in any real estate transaction.
Understanding appraisal reports isn’t just a nice-to-have skill. It’s a must. When you know your way around these reports, you’re in a better position to advise your clients, negotiate deals, and close sales. It’s about leveling up your game in the competitive world of real estate. So, are you ready to dive in? Let’s do this.
Tip 1: Know the Basics
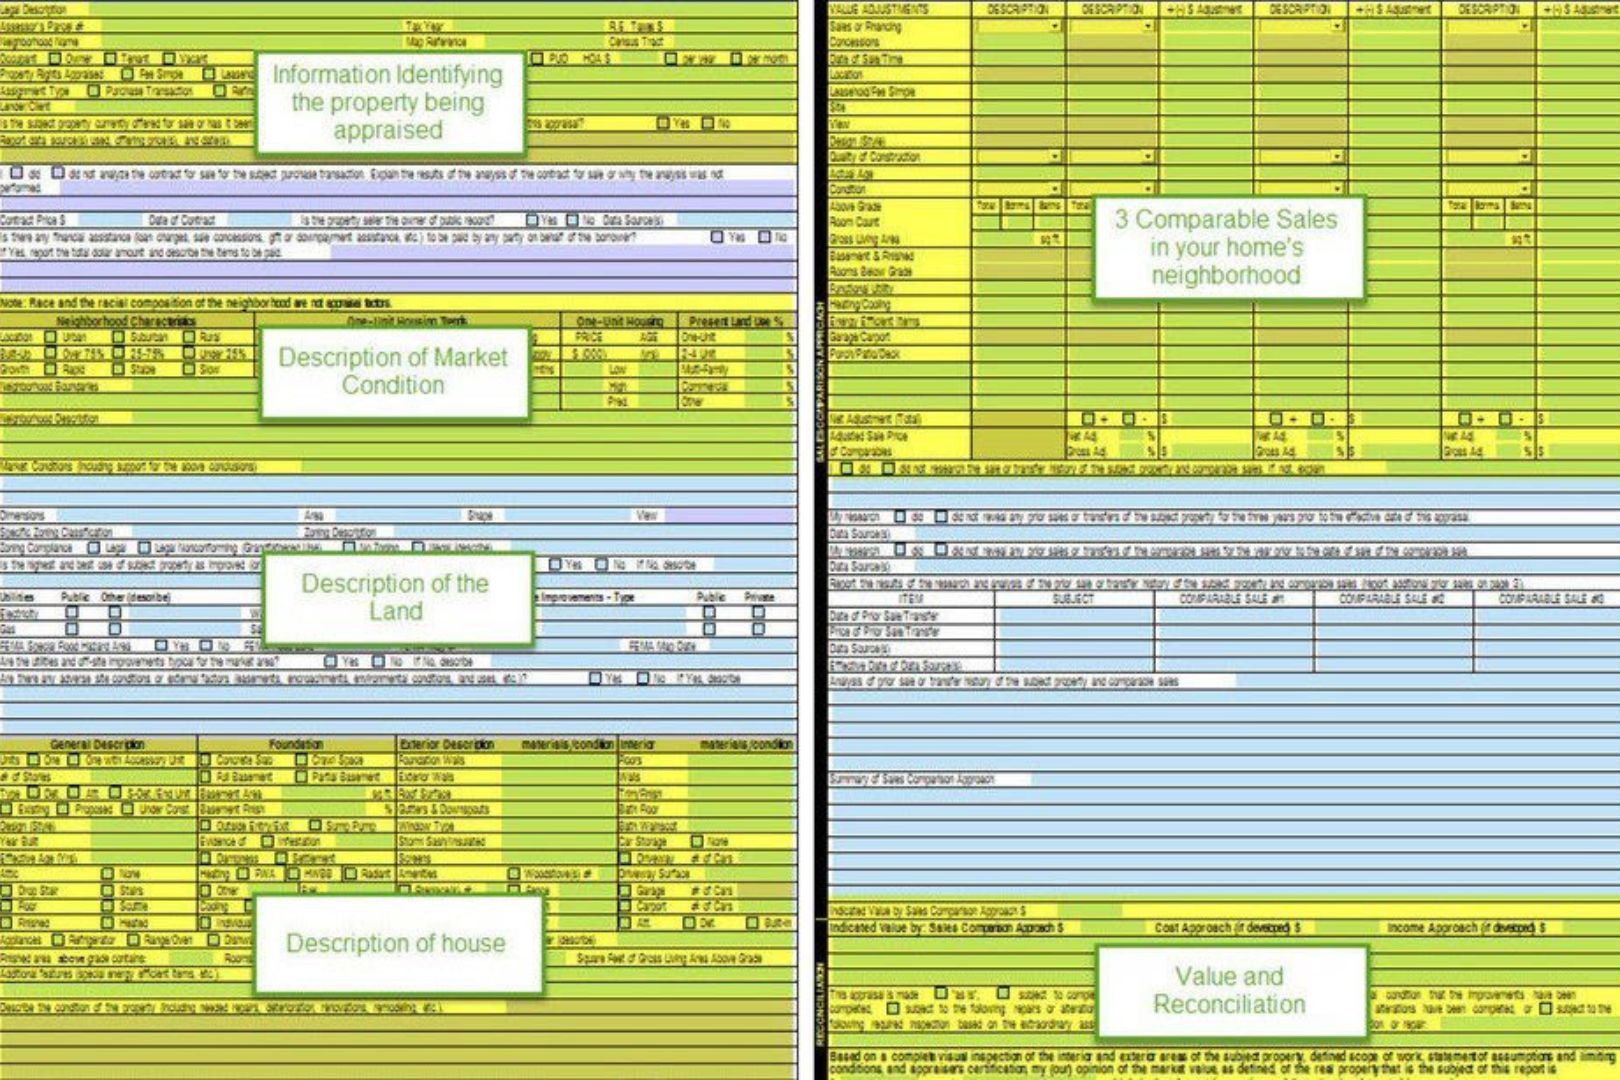
First, you’ve got the ‘Subject’ section. This is where you’ll find information about the property in question. It’s the ‘who’ and ‘where’ of the report. Details like the property address, legal description, and owner’s name are all nestled in here.
Next up is the ‘Contract’ section. If there’s a sale going on, this is where you’ll find the details. Think purchase price, contract date, and the like. It’s the ‘what’ and ‘when’ of the report.
Then we’ve got the ‘Neighborhood’ section. This is where the appraiser paints a picture of the area surrounding the property. It’s the ‘context’ of the report, giving you a snapshot of the local real estate market and the broader forces at play.
The ‘Improvements’ section is next in line. This is where the property itself comes under the microscope. Everything from the home’s condition to its unique features is laid out here. It’s the ‘how’ of the report, showing you what the property has (or doesn’t have) going for it.
Finally, we have the ‘Valuation’ and ‘Reconciliation’ sections. This is where the rubber meets the road. After considering all the data, the appraiser provides an estimated market value for the property and explains how they arrived at that figure. It’s the ‘why’ and ‘so what’ of the report, tying everything together.
FYI the Valuation sections encompasses the Sales Comparison Approach, the Income Approach and the Cost Approach.
Now, let’s talk key terms. ‘Subject’, ‘Contract’, ‘Neighborhood’, ‘Improvements’, ‘Valuation’, ‘Reconciliation’ – these are your new best friends. Get to know them, understand them, and you’ll be well on your way to mastering the art of reading appraisal reports.
Remember, knowledge is power. The more you understand the basics, the better equipped you’ll be to navigate the complex world of real estate appraisals. It’s not rocket science, but it does require a bit of dedication. Are you up for the challenge?
Tip 2: Understand the Purpose of the Appraisal

So, you’ve got the basics down. Great! But let’s not stop there. Why is the appraisal being done in the first place? Knowing the ‘why’ can provide a whole new perspective on the ‘what’.
There are several reasons an appraisal might be ordered. Maybe it’s for a home sale, or a refinancing deal. Maybe it’s for an estate settlement or a divorce settlement. Each purpose has its own unique considerations that can impact the final appraisal report.
Let’s say the appraisal is for a home sale. The main objective here is to determine if the contract price is in line with market realities.
On the other hand, an appraisal for a estate settlement may focus more on the market value as of “date of death”, which might not necessarily align with the current market value.
Why does this matter? Because the purpose of the appraisal can directly influence the report. It can affect the approach the appraiser takes, the comparables they select, and the adjustments they make.
In essence, understanding the ‘why’ behind the appraisal can help you better understand the ‘what’ in the report. It’s not just about reading the numbers, it’s about comprehending the story those numbers are telling.
So next time you’re handed an appraisal report, take a moment to ask – why was this appraisal done? The answer might just change the way you read the report.
Tip 3: Pay Attention to the Comparables
Alright, let’s chat about comparables, or “comps” as they’re often called in the biz. These are properties similar to the one being appraised that have recently sold or are currently on the market. They play a key role in determining the appraised value of a property. Think of them as the yardstick by which your property is measured.
The comparables are analyzed in the Sales Comparison Analysis section of an appraisal report. This section can seem like a jumble of numbers and terms, but it’s not as daunting as it looks.
Here’s the lowdown: each comp is listed with its selling price, and various features such as location, size, age, condition, and amenities. These features are compared to those of the property being appraised, and adjustments are made to the comp’s selling price based on the differences.
So, how do you make sense of this section? Here’s a tip: don’t get too caught up in the individual adjustments. Instead, look at the big picture. Are the comps similar to your property? Are they in the same neighborhood? Do they have similar features? If the answer is yes, then the appraised value is likely on point.
But if the comps seem off – maybe they’re in a different neighborhood, or they’re significantly larger or smaller – that could be a red flag. Remember, comps are a major factor in determining the appraised value. If they’re not truly comparable, the value could be skewed.
So, keep a keen eye on the comparables. They’re more than just numbers on a page – they’re a crucial piece of the appraisal puzzle.
Tip 4: Review the Adjustments

So, you’ve got your hands on an appraisal report and you’re cruising through the comparables. You’re feeling good, feeling confident. But then, you hit the adjustments section and suddenly, it’s like you’ve run into a brick wall. Don’t worry, it’s not as daunting as it seems. Let’s break it down.
Adjustments, in the simplest terms, are like the tweaks on a stereo equalizer. They’re used to level the playing field between the subject property and the comparables.
For instance, if a comparable property has a swimming pool and the subject property doesn’t, an adjustment is made to account for this difference. This ensures that you’re comparing apples to apples, not apples to oranges.
But how do you interpret this section? Well, it’s not about just looking at the numbers. It’s about understanding the story those numbers tell.
When you see a negative adjustment, it means the comparable is superior to the subject property in that aspect. A positive adjustment, on the other hand, indicates the subject property is superior.
Pro Tip
CBS – Comparable Better? – Subtract!
CIA – Comparable Inferior? – Add!
The key here is to not get lost in the figures. Instead, try to understand the rationale behind each adjustment. Why was it made? How does it affect the overall value? Remember, each adjustment is a piece of the puzzle that forms the final appraisal value.
Now, you might be wondering, “What if I disagree with an adjustment?” That’s a valid concern. The key questions is: “Is the adjustment market based? – Is it supported by evidence?
The appraisers support for his or her adjustments should be noted in the comments or addenda. Understand their perspective and use that knowledge to better serve your clients.
So next time you’re faced with the adjustments section, don’t panic. Take a deep breath, review each adjustment carefully, and try to see the story behind the numbers. It might take some practice, but once you get the hang of it, you’ll be able to navigate this section like a pro.
Tip 5: Don’t Ignore the Conditions and Assumptions

This section isn’t just small print. It’s the equivalent of the secret sauce in a gourmet recipe. Ignore it at your peril. The conditions and assumptions section of an appraisal report often gets sidelined, but it’s a crucial part of the whole narrative. It’s like the director’s commentary on a movie. You get to understand the ‘why’ behind the ‘what’.
Why is it so important? It’s because this section outlines the terms under which the appraisal was made. It’s a list of all the factors that the appraiser assumed to be true when determining the value of the property.
This could include anything from zoning laws to the physical condition of the property. It’s the lens through which the appraiser viewed the property, and it can significantly impact the final appraisal value.
Think of it like this: you’re a detective, and this section is a vital clue that helps you piece together the full picture. If you don’t consider these conditions and assumptions, you might end up with a distorted understanding of the property’s value.
So, how do you navigate this section? Start by reading it carefully. Don’t skim. Each assumption or condition is a piece of the puzzle. If something seems off or doesn’t make sense, flag it. Ask questions. Challenge assumptions.
Remember, your job is to get a complete and accurate understanding of the property’s value. You can’t do that if you’re working with incomplete or inaccurate information.
The conditions and assumptions are not just a footnote. It’s a crucial part of the appraisal report that deserves your full attention. Ignore it at your own risk.
Unfortunately, assumptions can be written anywhere in the report, but they are required to be prominent wherever they are placed.
Tip 6: Look for Errors

It’s a little-known secret that even appraisal reports, as official as they may seem, can be prone to human error. And while it’s not exactly like hunting for Waldo, spotting these mistakes requires a keen eye and a solid understanding of the appraisal process.
Common errors can range from minor typos to major miscalculations. They might be as simple as misspelled names and incorrect property addresses, or as significant as erroneous square footage calculations and inaccurate comparable sales data. These mistakes, while they might seem trivial, can have a profound impact on the final appraisal value.
So, how do you play detective with an appraisal report? First, don’t rush. Take your time to thoroughly review each section of the report.
Pay special attention to the property description and the comparable sales used. Ensure the information aligns with what you know about the property and the local market.
Second, question everything. Does the reported square footage match your records? Do the comparable sales seem appropriate? If something seems off, it probably is.
Lastly, don’t hesitate to reach out to the appraiser for clarification. Remember, it’s not about challenging their expertise but about ensuring accuracy. After all, we’re all human and mistakes do happen.
Looking for errors isn’t about being nitpicky—it’s about safeguarding your client’s interests and maintaining the integrity of the transaction. So, put on your detective hat and start scrutinizing those appraisal reports.
Tip 7: Consult with the Appraiser

Ever heard the saying, “two heads are better than one?” It rings true in the world of real estate appraisals as well. The final, and arguably one of the most important, tips is to establish an open line of communication with the appraiser.
Why? Because appraisers are the masters of their craft, they hold a wealth of knowledge that can provide you with invaluable insights into the appraisal report.
Now, you might be thinking, “Great, but how do I approach this conversation without sounding like I’m questioning their expertise?” Good question. Here’s how.
Firstly, approach the conversation with genuine curiosity. You’re not there to challenge their appraisal, but to understand it. Ask them to explain the reasoning behind their choices, particularly if something isn’t clear to you.
A phrase like “Could you help me understand why this particular comparable was chosen?” comes across as much more collaborative than confrontational.
Secondly, make it a two-way street. Share your knowledge about the property and its neighborhood. You might have information that the appraiser wasn’t aware of, like upcoming developments in the area or recent sales that weren’t listed publicly. This can be incredibly beneficial to both parties.
Finally, remember to respect their time and expertise. Appraisers are busy professionals, so keep your questions concise and to the point.
And remember, while it’s okay to ask for clarification, it’s not okay to pressure an appraiser to change their valuation. Their independence and objectivity are crucial aspects of their role.
In a nutshell, don’t be a stranger to the appraiser. A little bit of communication can go a long way in helping you understand an appraisal report. Plus, it can strengthen your professional relationships, making future appraisals a smoother process.
Conclusion
Alright, so we’ve covered a fair bit of ground here. Let’s take a moment to circle back and recap the seven pointers that can make reading appraisal reports less of a headache and more of a breeze for you.
First off, get your head around the basics. Know the structure, understand the key terms. Next, grasp the purpose of the appraisal. It’s not just numbers and figures; there’s a story behind it all. Then, give due attention to the comparables and adjustments. They’re not just fillers; they play a significant role in the valuation.
Also, don’t let your eyes glaze over the conditions and assumptions section. It’s not just fine print; it can seriously impact the appraisal value. And while you’re at it, be on the lookout for errors. They’re not just typos; they can skew the entire report.
Lastly, don’t hesitate to reach out to the appraiser. They’re not just report generators; they can provide valuable insights and clarifications.
Well, we’ve come to the end. I really hope this guide has helped you to understand appraisal reports better. If I can be of service to you as you navigate the world of appraisals, please reach out. I am always happy to help.
Keep learning, keep growing, and keep rocking the real estate world!
by Conrad Meertins | Dec 23, 2024 | Valuation

When it comes to real estate transactions, appraisals are crucial. They determine the value of a property and can significantly impact the outcome of a deal. But what if the appraisal seems off? Here are five red flags you should look out for in your appraisal report.
Introduction
Ever wondered what makes an appraisal report a cornerstone of real estate transactions? Well, an appraisal report is a comprehensive analysis that provides an expert opinion of the market value of a property. It’s like the GPS of a real estate transaction, guiding all parties involved on the right value path.
Picture this: You’re about to buy a house. It’s charming, it’s cozy, it’s perfect. But is it worth the price tag? That’s where an appraisal comes in. It ensures that the property’s price aligns with its actual worth, protecting buyers from overpaying and sellers from underselling.
But here’s the kicker: not all appraisals are created equal. Accuracy is the name of the game. An inaccurate appraisal can be like a faulty GPS, leading you down a winding path to a destination that doesn’t match your expectations. It can throw off the balance of a transaction, causing headaches for buyers, sellers, and lenders alike.
That’s why it’s crucial to keep an eagle eye on your appraisal report, to ensure it’s as accurate as a Swiss watch. In the following sections, we’ll examine five red flags that could indicate your appraisal needs a second look. So buckle up, and let’s get started.
Red Flag 1: Inaccurate Property Details

Picture this: you’re excited about a property you’re considering for purchase. You’ve walked the rooms, admired the square footage, counted the bathrooms. But then you receive the appraisal report and something seems off.
The report states the property has one less bathroom than you’ve physically counted, and the square footage seems underreported. This, my friend, is a red flag waving right at you.
Inaccurate property details in an appraisal report, such as incorrect square footage or number of rooms, can significantly skew the appraisal value.
It’s like trying to compare apples to oranges; you’re not getting a true value comparison. This could lead to a lower appraisal than what the property might actually be worth, and you could be on the losing end of the deal.
So, how do you spot these errors? It’s simple. Compare the property details in the appraisal report with the actual property specifications. This could be from your own observations during a property visit or from the property listing details. If there’s a discrepancy, it’s time to raise an eyebrow.
And what do you do if you find these errors? Reach out to the lender or appraiser for clarification. It could be a simple oversight that can be easily corrected. If the appraiser stands by the inaccurate details, consider getting a second opinion.
Remember, when it comes to real estate transactions, knowledge is power and accuracy is key. Stay vigilant and don’t be afraid to question the details.
Red Flag 2: Ignoring Comparable Sales

Ever heard the saying, “You’re only as good as the company you keep?” Well, in the world of real estate appraisals, it’s more like, “Your property’s value is only as accurate as the comps it’s compared to.” Comparable sales, or “comps,” are the lifeblood of a solid appraisal. They’re the benchmark against which your property’s value is measured.
Imagine you’re selling a three-bedroom house with a spacious backyard and a newly renovated kitchen. It would be reasonable to compare your property to a similar one that recently sold in your neighborhood.
But what if the appraiser compares it to a smaller, outdated property or one in a less desirable location? The result could be a skewed appraisal that undervalues your property.
So, how do you spot this red flag? It’s all about doing your homework. Research recent sales of similar properties in your area. If the comps used in your appraisal don’t match up, that’s a red flag.
But don’t stop there. If you find discrepancies, bring them to the attention of the appraiser or lender. Provide them with the accurate comps and ask for a review of the appraisal. Remember, it’s not about challenging the expertise of the appraiser, but ensuring the accuracy of your appraisal. After all, your property’s worth is on the line.
Red Flag 3: Inexperienced Appraiser

Imagine walking into a restaurant, and the chef tells you it’s his first day cooking. You’d probably be a bit apprehensive, right? The same goes for appraisals. An inexperienced appraiser is like a rookie chef – they might know the basics, but they lack the finesse and insight that come with years of experience.
An inexperienced appraiser might miss subtle details or nuances that a seasoned pro would catch. This could lead to a less accurate valuation of your property, which could impact your transaction significantly. Picture this – an appraiser underestimates the value of your property by 10%. That could mean thousands of dollars left on the table. Ouch!
So, how do you know if your appraiser is a rookie or a seasoned pro? Again, it’s all about doing your homework. Check their credentials and ask about their experience. How long have they been in the business? How many appraisals have they done? Have they worked in your area before? These questions can give you a sense of their level of expertise.
Also, remember that experience isn’t just about quantity; it’s about quality too. Has the appraiser continued their education and stayed up-to-date with industry trends? Have they received positive feedback from clients? These factors can indicate whether an appraiser has the experience and knowledge necessary to provide an accurate, fair valuation.
In the end, if something doesn’t feel right, don’t be afraid to speak up or seek a second opinion. After all, it’s your property and your transaction on the line. Don’t settle for less than the best.
Red Flag 4: Geographic Incompetence

“Geographic incompetence” sounds like an insult you’d throw at a lost tourist, doesn’t it? Well, in the realm of real estate appraisals, it’s a real issue that can make or break a property’s valuation. Let’s break it down.
Geographic incompetence refers to an appraiser’s lack of familiarity with the area where the property is located. It’s like asking a New Yorker for the best bourbon tasting here in Louisville– they might have an opinion, but it’s unlikely to be as informed as a local’s.
When an appraiser doesn’t know the local market well, they can miss crucial details that impact a property’s value. This could include anything from overlooking local amenities to failing to account for the area’s growth potential or unique real estate trends.
So, how do you spot this red flag? You might notice a lack of local comparable sales in the report or a disregard for location-specific factors that could affect the property’s value. The appraiser might also make assumptions or generalizations that don’t quite fit with what you know about the area.
If you suspect geographic incompetence, don’t panic. Instead, take action. Ask the appraiser about their experience with your area. If they’re not forthcoming or their answers don’t inspire confidence, consider informing your lender or getting a second opinion. As I said before, it’s your property, your deal, and you have the right to an accurate appraisal.
Remember, even seasoned appraisers can falter when they step out of their geographic comfort zone. It’s up to you to ensure your property is evaluated by someone who knows the lay of the land.
Red Flag 5: Bias or Prejudice

Let’s take a moment to think about the last time you had to make a decision. Did you rely solely on facts and figures, or did your personal feelings or preconceived notions come into play? Now, imagine that same scenario, but in the context of an appraisal. Bias or prejudice, whether intentional or subconscious, can significantly skew an appraisal, leading to a less-than-accurate property valuation.
Bias in an appraisal can manifest in various ways. It might show up as favoritism towards a certain type of property or neighborhood, or it could be a negative bias against properties in less affluent areas. Prejudice, on the other hand, could stem from personal beliefs or experiences, and can equally distort an appraiser’s judgment.
Spotting signs of bias or prejudice in an appraisal can be tricky, as they often hide behind the veil of professional discretion. However, a few telltale signs might include a lack of comparable sales in the report, or a repeated pattern of undervaluing certain types of properties or locations.
If you suspect bias or prejudice in your appraisal, it’s essential to address it head-on. Start by discussing your concerns with the appraiser. Remember, it’s entirely possible for bias to be unintentional, and a professional appraiser should be open to reassessing their work.
If the appraiser dismisses your concerns, consider seeking a second opinion. It’s crucial to ensure your property is evaluated objectively and accurately, free from any bias or prejudice.
In the end, the goal is to ensure fairness and accuracy in the appraisal process. By being vigilant and knowledgeable, you can play an active role in achieving this.
Navigating Property Value Disputes

When you’ve spotted a red flag in your appraisal report, what’s the next step? How do you navigate the choppy waters of property value disputes? Don’t worry, it’s not as daunting as it sounds. You’re not the first to face this, and certainly won’t be the last. Let’s walk through this together.
First things first, keep calm. A dispute doesn’t mean you’re at a dead-end. It’s simply a bump in the road that calls for some negotiation and, possibly, a little professional intervention.
Your first option is to request a second opinion. Just like in medicine, a second opinion in real estate can provide a fresh perspective, a different angle. It’s not about questioning the first appraiser’s competence (although sometimes, that might be the case), but about ensuring you have the most accurate and fair evaluation.
Remember, every appraiser brings their own experience and expertise to the table, and a second opinion might just bring you closer to the true value of your property.
But what if a second opinion isn’t enough? What if the dispute persists? This is where challenging the appraisal comes into play. To do this, you’ll need to gather solid evidence to support your claim. This might include recent comparable sales that were overlooked, or specific, factual errors in the report. It’s not about discrediting the appraiser, but about ensuring the report reflects the true value of your property.
In the end, navigating property value disputes requires a balanced blend of patience, assertiveness, and a good understanding of the appraisal process. It’s not about winning or losing, but about ensuring fairness and accuracy. After all, your property isn’t just a number on a report, it’s a significant investment. And it deserves a fair and accurate appraisal.
Conclusion
In the bustling realm of real estate, the appraisal report is your compass. It’s what guides you through the terrain of transactions, pointing out the true value of the property in question. But just like any compass, it needs to be accurate to be of any use. This is why it’s crucial to keep an eye out for those red flags we’ve talked about.
Remember, the devil is often in the details. Inaccurate property details can skew the appraisal, leading to a value that’s either too high or too low. Comparable sales, when overlooked or misused, can also throw off the appraisal.
The competency and impartiality of the appraiser are equally vital. An inexperienced appraiser or one with a geographic incompetence can easily miss the mark. And let’s not forget the role of bias or prejudice, subtle as it may be, in influencing the appraisal.
So, what’s the takeaway from all this? Vigilance and knowledge are your best allies in ensuring a fair and accurate appraisal. In the end, it’s all about ensuring that the real estate transaction is fair for all parties involved. And armed with the information we’ve discussed, you’re well on your way to doing just that.
So, go forth and conquer the world of real estate, one accurate appraisal at a time.
If you need an appraisal ally, give me a call. I am always here to help!
by Conrad Meertins | Dec 16, 2024 | Uncategorized
You’ve heard it before: the home is where the heart is. But it’s also where a good chunk of your financial investment lies. Whether it’s your forever home or a stepping stone to your dream abode, you’ve probably considered some form of home renovation.
Maybe you’re looking to add a touch of comfort, or perhaps you’re aiming to increase your property’s market value. Either way, it’s crucial to understand the dynamics between home renovations and market value.
Think of your home as an artist’s canvas. Each stroke of renovation you add can either enhance the masterpiece, increasing its worth, or muddy the image, making it less attractive to potential buyers.
Not all renovations are created equal, and some can even detract from your home’s value. So, how do you navigate this tricky terrain?
That’s where I, your appraiser friend, come in. This article aims to be your trusty compass, guiding you through the world of home renovations and their impact on market value.
We’ll dive into the correlation between the two, explore the types of renovations that can boost your home’s worth, and even discuss some improvements that might not add the value you’d expect.
Understanding the relationship between renovations and market value is not just about making savvy financial decisions. It’s about creating a space that’s both personally fulfilling and economically smart. So, grab your hard hat and let’s get started!
The Relationship Between Home Renovations and Market Value
Imagine this: you’ve decided to renovate your home, perhaps you’ve upgraded your kitchen with sleek granite countertops, installed a luxurious whirlpool bathtub in your bathroom, or maybe you’ve transformed your backyard into an inviting oasis with a pool and a deck.
You’ve invested time, effort, and a good chunk of change into these projects, but have you ever paused to consider how these changes are affecting your home’s market value?
The relationship between home renovations and market value is a fascinating one. It’s a bit like cooking a gourmet meal; the right ingredients, when combined thoughtfully, can create a dish that’s worth more than the sum of its parts. Similarly, strategic renovations can significantly increase your home’s market value.
But let’s be clear: not all renovations are created equal. While some can boost your home’s value considerably, others might not have the same effect. It’s a bit of a balancing act, knowing which renovations will reap the most rewards.
This is why understanding the correlation between home renovations and market value is crucial. It’s not just about making your home look better; it’s about making strategic improvements that will increase its worth in the eyes of potential buyers.
It’s like playing chess; every move you make should be deliberate, with an eye on the endgame. Renovating willy-nilly can lead to a mishmash of styles and improvements that don’t necessarily add value.
But when you renovate strategically, you’re investing in your home’s future, and that can pay off big time when it’s time to sell.
So, the next time you’re considering a home renovation project, don’t just think about the immediate benefits. Think about the potential impact on your home’s market value. Because in the grand scheme of things, that’s where the real payoff lies.
Types of Renovations That Improve Market Value

Now that we’ve established the connection between home renovations and market value, let’s dive a little deeper. The key lies in identifying those improvements that are likely to appeal to a broad range of potential buyers.
First on the list is the heart of any home – the kitchen. A well-executed kitchen remodel can significantly increase the value of your home. Think about it: the kitchen is where families gather, meals are prepared, and memories are made.
It’s not just about having the latest appliances or the most fashionable countertops. It’s about creating a functional, welcoming space that can adapt to a family’s evolving needs.
Bathroom upgrades are another smart investment. Modern buyers are looking for bathrooms that offer a sense of luxury and relaxation.
This doesn’t necessarily mean you need to install a top-of-the-line whirlpool tub or a rainfall showerhead (although those can be nice!). Sometimes, simple updates like new fixtures, fresh paint, or improved lighting can make a world of difference.
Don’t forget about the outdoors. In today’s market, outdoor living spaces are more valuable than ever. This could mean adding a deck or patio, sprucing up your landscaping, or even installing a pool if it fits with the overall vibe of your neighborhood (i.e. you’re in Florida and every home but yours has a pool).
Lastly, consider the overall flow and functionality of your home. Are there walls that could be knocked down to create an open-concept living area? Could the attic be transformed into a cozy loft? These types of renovations can not only make your home more enjoyable to live in, but also more appealing to potential buyers.
The bottom line? Renovations that improve the functionality, appeal, and overall quality of your home are likely to increase its market value. But remember, every home and every market is unique.
What works in one area might not work in another. That’s why it’s always a good idea to consult with a real estate appraiser before making any major renovation decisions. They can provide valuable insight into what buyers in your area are looking for and help you make the most of your renovation budget.
Tips for Successful Home Renovations

So, you’re ready to jump into the home renovation bandwagon? That’s great! But before you do, let’s sit down and talk about how to make your home renovations work for you, not just in terms of aesthetics, but more importantly, in improving your home’s market value.
First off, the importance of planning and budgeting cannot be overstated. Imagine walking into a grocery store without a shopping list. You might end up with a cart full of items you don’t need, right? The same principle applies to home renovations.
Without a solid plan, you risk spending money on renovations that don’t significantly increase your home’s market value. So, take the time to identify which areas of your home need improvement and how much you’re willing to spend on each project.
Next, let’s talk about quality. You might be tempted to cut corners to save money, but remember, you get what you pay for. High-quality materials and workmanship not only add value to your home but also save you from potential headaches down the line.
Think about it: if a buyer walks into your newly renovated kitchen and sees that the cabinets are poorly installed or the tiles are chipped, do you think they’d be willing to pay top dollar for your home? Probably not.
Now, you might be thinking, “But I’m not a renovation expert. How do I ensure quality?” That’s where hiring professionals comes in. Yes, it might cost more upfront, but having experts handle your renovations can ensure that the work is done right the first time. Plus, they can offer valuable insights into what renovations can boost your home’s market value.
Lastly, remember that successful home renovations aren’t just about making your home look pretty. They’re about making strategic improvements that can increase your home’s market value.
So, before you start knocking down walls or installing a new bathtub, ask yourself, “Will this renovation appeal to potential buyers? Will it improve the functionality and overall appeal of my home?” If the answer is yes, then you’re on the right track.
In the end, successful home renovations are all about balance. It’s about balancing your personal preferences with what potential buyers might want, balancing aesthetics with functionality, and balancing your budget with the potential return on investment.
So, take the time to plan, prioritize quality, hire professionals, and make strategic improvements. Your home—and your wallet—will thank you.
Renovations That May Not Add Value

So, you’ve got a wild idea for a renovation. Maybe you’re thinking of installing an indoor rock climbing wall in the living room or perhaps you’re contemplating transforming your basement into a full-scale replica of the Starship Enterprise.
While these may be thrilling personal projects, it’s important to remember that not all renovations add value to your home. In fact, some could even decrease your property’s market value. Let’s delve into this.
Firstly, overly personalized renovations can be a double-edged sword. On one hand, they make your home uniquely yours, a space that reflects your personality and passions. On the other hand, these renovations may not appeal to potential buyers who don’t share your particular interests.
A home with a custom-built aquarium in the master bedroom or a jungle-themed kitchen may be your dream come true, but for others, it might be a remodeling nightmare.
Secondly, luxury upgrades that exceed the neighborhood’s standard could also fail to add significant value. Imagine installing a top-of-the-line, professional-grade kitchen in a neighborhood of starter homes.
Sure, it’s a fantastic feature, but if it dramatically inflates your home’s price compared to other properties in the area, buyers might not bite. After all, they’re shopping in your neighborhood for a reason, and if your home’s price significantly exceeds the norm, it may be out of their budget.
Lastly, renovations that neglect the home’s overall harmony could potentially be detrimental. For instance, if you upgrade only one room while leaving the rest of the house outdated, it could create a jarring contrast that detracts from the overall appeal.
So, what’s the takeaway here? While it’s your home and you should absolutely love the space you’re in, it’s crucial to strike a balance. If you’re considering a renovation with the hopes of adding value to your home, think strategically.
Reflect on whether your project will have broad appeal, align with the standards of your neighborhood, and contribute to the overall coherence of your home.
How to Evaluate the Potential Return on Investment (ROI) for a Renovation

When it comes to home renovations, we’re not just talking about a fresh coat of paint or a new doorknob. We’re discussing investments, sometimes hefty ones, that can significantly affect your home’s market value. So, before you take the plunge, it’s crucial to evaluate the potential return on investment (ROI) for a renovation.
But how do you do that?
First, start by understanding the cost of the renovation. This isn’t just about the upfront expenses of materials and labor. Consider the ongoing maintenance costs, potential increased utility bills, and any other recurring costs that might be associated with the renovation.
Next, consider the potential increase in market value. This is where things get a bit tricky. You might be in love with the idea of a gold-plated bathtub, but will potential buyers feel the same way? Research the real estate market in your area and similar homes to get a sense of what renovations are adding value.
It’s also important to consider the timeline. If you’re planning to sell your home soon, you’ll want to focus on renovations that can provide a quick return on investment.
On the other hand, if you’re planning to stay in your home for several years, you might have more flexibility to consider renovations that will increase your enjoyment of the home, even if they don’t have an immediate impact on its market value.
Remember, not all renovations are created equal. A kitchen remodel might yield a high return on investment, while a luxury upgrade to your home theater might not. It’s all about finding the balance between what you want and what the market values.
Ultimately, evaluating the potential ROI for a renovation requires a mix of research, careful planning, and a bit of intuition. It’s not an exact science, but with some due diligence, you can make renovations that not only improve your quality of life but also boost your home’s market value.
The Impact of Renovations on Homeowner Happiness

Now, let’s take a detour from the financial aspect and delve into the emotional realm. After all, a home is not just a property; it’s a personal sanctuary, a space that should bring joy and satisfaction. So, how do renovations impact homeowner happiness?
According to the Home Remodeling Projects That Pay Back The Most In Happiness report, certain renovations significantly enhance homeowner happiness. For instance, a complete kitchen renovation, one of the most impactful upgrades you can make in terms of market value, also tops the list in terms of homeowner joy.
Imagine the satisfaction of cooking in a newly renovated kitchen with state-of-the-art appliances, custom cabinetry, and sleek countertops. It’s not just about the potential monetary return; it’s also about the personal enjoyment you derive from such improvements.
But here’s where it gets interesting: this happiness can indirectly affect market value. Think about it. A happy homeowner is likely to maintain their home better, addressing minor issues before they become major problems. This level of care and attention to detail can significantly enhance a home’s long-term market value.
Moreover, the emotional connection a homeowner feels towards their renovated home can translate into a more compelling sales pitch when it’s time to sell. Buyers don’t just purchase a property; they buy into a lifestyle, a vision of what their life could be in that home.
A homeowner who has derived genuine joy from their home can communicate that feeling more effectively to potential buyers, potentially commanding a higher selling price.
So, while it’s essential to consider the financial implications of renovations, don’t underestimate the power of homeowner happiness. The joy and satisfaction derived from improving your living space can have tangible benefits, both for your quality of life and your home’s market value.
Conclusion
As we draw this conversation to a close, it’s crucial to reflect on the core message: the importance of understanding how renovations can affect your home’s market value.
Just as a skilled chef knows that each ingredient can dramatically alter the taste of a dish, a savvy homeowner recognizes that every renovation – big or small – can significantly influence the market value of their home.
But let’s not forget – it’s not just about the money. While increasing your home’s market value is an undeniable benefit, the personal value derived from renovations shouldn’t be overlooked.
Whether it’s the joy of cooking in a newly remodeled kitchen or the peace of mind that comes with a reinforced roof, the happiness and satisfaction that these improvements bring are priceless.
Think of your home as a canvas. Each stroke of renovation not only adds to the aesthetic appeal but also contributes to the overall worth of the masterpiece. But remember, it’s not just about creating a showpiece for others to admire.
It’s about crafting a space that reflects your personality, caters to your needs, and yes, boosts your property’s market value.
So, whether you’re planning a minor tweak or a major overhaul, consider both the financial and personal value. Strategize, budget, and focus on quality.
After all, a well-planned renovation can be a win-win situation, enhancing both your quality of life and the thickness of your wallet.
Remember, the world of home renovations is vast and varied, and there’s always more to learn. So, keep exploring, keep improving, and most importantly, keep enjoying the process.
After all, home is not just a place, it’s a feeling. And every improvement you make is another step towards perfecting that feeling.