by Conrad Meertins | Nov 6, 2024 | Uncategorized

Could skipping an appraisal save you money—or cost you thousands? In a bid to boost home affordability, Fannie Mae and Freddie Mac recently announced expansions to their appraisal waiver programs, starting in the first quarter of 2025.
This move could allow more buyers to bypass traditional appraisals, potentially saving hundreds in upfront costs and speeding up the closing process. Designed to assist first-time and low- to moderate-income buyers, this initiative has already saved borrowers over $2.5 billion since 2020, according to Fannie Mae.
But while the program may offer an easier path to homeownership, it raises critical questions for buyers. Can bypassing a full appraisal expose you to risks that could hurt your financial future?
What is the Announcement?

Fannie Mae and Freddie Mac, the government-sponsored enterprises backing most U.S. mortgages, are expanding the eligibility for appraisal waivers. These waivers, designed to reduce costs and simplify the process, allow certain buyers to purchase homes without a traditional appraisal. Here’s a quick breakdown of the options:
Value Acceptance (formerly appraisal waivers): Uses data modeling to confirm the property’s value and sale price.
Value Acceptance + Property Data: Involves a trained professional collecting data on the property’s interior and exterior.
Automated Collateral Evaluation (ACE): Freddie Mac’s program that uses proprietary models and public records to assess property values.
ACE + Property Data Report (PDR): Combines Freddie Mac’s models with on-site property data collection.
With these changes, loan-to-value (LTV) ratios for waiver eligibility are also increasing, allowing up to 90% LTV for standard waivers and up to 97% for inspection-based waivers. For many buyers, this expanded access means greater flexibility and faster closings.
What Should Buyers Know?

While appraisal waivers can offer benefits, it’s essential to consider the risks. Here are a few crucial points:
Overpaying: Without an independent appraisal, there’s a risk you might pay more than the property’s true market value. Lender models might miss local nuances, causing buyers to unknowingly overpay.
Limited Negotiation: If the lender’s valuation is higher than expected, it might restrict your ability to negotiate a lower price, limiting any wiggle room with the seller.
Missed Issues: An algorithm can’t catch everything. Unlike a traditional appraiser who can inspect the property firsthand, automated data models may overlook physical issues like a weakened foundation or faulty wiring, which could lead to expensive repairs down the line.
Imagine buying a home with an inflated valuation, only to discover costly issues that a standard appraisal might have caught. Waiving an appraisal could mean shouldering unexpected financial strain, especially if you need to sell during a downturn.
It’s important to remember that in 2023, over 31% of American households were already spending more than 30% of their income on housing. Adding hidden property issues could increase that burden even further.
What’s Missing from the Announcement?

While Fannie Mae and Freddie Mac promote the benefits of waivers, here are some points they didn’t mention that buyers should consider:
Conflicts of Interest: Lenders have a vested interest in closing deals quickly and efficiently, which may lead them to prioritize speed over thorough property assessment.
Buyer Responsibility: It’s ultimately on the buyer to ensure they’re paying a fair price. Relying solely on lender valuations can create a “blind spot” in the homebuying process, as lenders focus primarily on their own financial risks.
With rapid price fluctuations—the Federal Housing Finance Agency’s House Price Index increased by over 57% from July 2019 to July 2024—it’s clear that a reliable property valuation is more crucial than ever. Proceeding without a traditional appraisal could leave buyers unprepared to navigate these changes.
How Can Buyers Protect Their Interests?

Navigating the appraisal waiver landscape can be challenging, but here are a few key ways buyers can safeguard their investments and make informed decisions:
Consider a Professional Appraisal: An independent appraisal offers an objective, expert valuation that goes beyond automated estimates. Appraisers are trained to assess property nuances and current market conditions, offering peace of mind and protecting buyers from potential pitfalls. This small investment can provide clarity and confidence, ensuring you’re on solid ground with your purchase.
Rely on Local Market Knowledge: Understanding a property’s true market value requires in-depth knowledge of local trends, comparable sales, and potential red flags. Appraisers specialize in this level of detailed market research, bringing a wealth of data to support fair and accurate valuations—especially valuable in a fluctuating market.
Seek Guidance from Experienced Professionals: Appraisers, along with real estate experts, are invaluable allies in the buying process. Leveraging their expertise ensures you have a clear view of the property’s value, equipping you to make decisions with lasting impact.
Conclusion
Appraisal waivers may offer convenience and cost savings, but it’s essential to consider the potential risks carefully. Overpaying, overlooking property issues, or facing an uncertain market could lead to costly setbacks.
A professional appraisal can provide the clarity and assurance buyers need to make informed, confident decisions. The path to homeownership might feel streamlined, but relying on expert guidance and a trusted valuation can help ensure it’s also a secure one.
Want to make confident, informed decisions on your homebuying journey? Visit our blog for expert insights on how a professional appraisal can protect your investment. Whether you’re navigating waivers or just starting, our articles are here to guide you every step of the way
by Conrad Meertins | Sep 30, 2024 | Uncategorized

Are you considering buying or selling a home in Louisville’s MLS Area 6, which includes Buechel, Highview, Okolona, and Fern Creek? Understanding current market trends is crucial for making informed decisions. Let’s dive into how these neighborhoods are faring in today’s real estate landscape.
Current Market Snapshot (as of September 28, 2024)
- Active Listings: 242
- Median Listing Price: $315,900
- Average Days on Market: 56 days
- Median Days on Market: 34 days
These numbers tell an interesting story. With homes staying on the market for nearly two months, buyers may find more room for negotiation, especially on properties listed for 50+ days. Sellers should note that pricing strategy is key in this market.
Price Trends: A Tale of Two Markets
- Median Listing Price (Active): $315,900
- Median Sales Price (Sold): $250,000
- Average Days on Market (Sold): 28 days
- Median Days on Market (Sold): 7 days
The significant gap between listing and selling prices suggests that while sellers are optimistic, buyers are more cautious. However, homes priced right are still moving quickly, often in less than a two weeks.
Supply & Demand: A Clearer Picture

- Current Active Listings: 242 (as of September 28, 2024)
- Total Sold Properties: 2,402 (from January 1, 2023 to September 28, 2024)
Let’s break this down:
- The 242 active listings represent what’s available right now in Buechel, Highview, Okolona, and Fern Creek.
- 2,402 properties sold over the past 21 months, averaging about 114 sales per month.
This suggests strong ongoing demand in Area 6, with current inventory limited compared to the consistent sales rate. It’s a market that favors sellers, but buyers who act decisively on well-priced homes can still find opportunities.
Property Characteristics

| |
Active Listings
|
Sold Properites
|
| Average Size |
1722 sq ft |
1525 sq ft |
Homes currently on the market tend to be larger and relatively newer. This could explain the higher listing prices and longer selling times, as these properties may be at the upper end of the local market.
What This Means for You
For Buyers:
- Be prepared for competition, especially for well-priced homes.
- Don’t hesitate to negotiate, particularly on homes that have been listed for a while.
- Consider the long-term value of larger, newer homes currently available.
For Sellers:
- Pricing is critical. Homes priced right are still selling quickly.
- Be prepared for negotiations, especially if your home has been listed for over 50 days.
- Highlight features that make your property stand out, such as size or recent updates.
Neighborhood Spotlight

Buechel, Highview, Okolona, and Fern Creek each offer unique attractions:
- Buechel: Known for its diverse community and proximity to Bardstown Road.
- Highview: Offers a suburban feel with easy access to downtown Louisville.
- Okolona: Popular for its parks and family-friendly atmosphere.
- Fern Creek: Balances rural charm with modern conveniences.
These varied neighborhoods contribute to the diverse housing options in Area 6, catering to a wide range of preferences and budgets.
Looking Ahead
The real estate market in MLS Area 6 reflects a balance between opportunity and challenge. While inventory is limited compared to recent sales volume, the longer days on market for current listings suggest a shift towards a more balanced market.
For both buyers and sellers, understanding these local trends is key to making informed decisions. Whether you’re looking to buy your first home, upgrade to a larger property, or sell your current house, the diverse neighborhoods of Area 6 offer something for everyone.
Interested in a more personalized analysis of your specific situation in Buechel, Highview, Okolona, or Fern Creek? Don’t hesitate to reach out. We’re here to help you navigate this dynamic market with confidence.
by Conrad Meertins | Sep 2, 2024 | Valuation
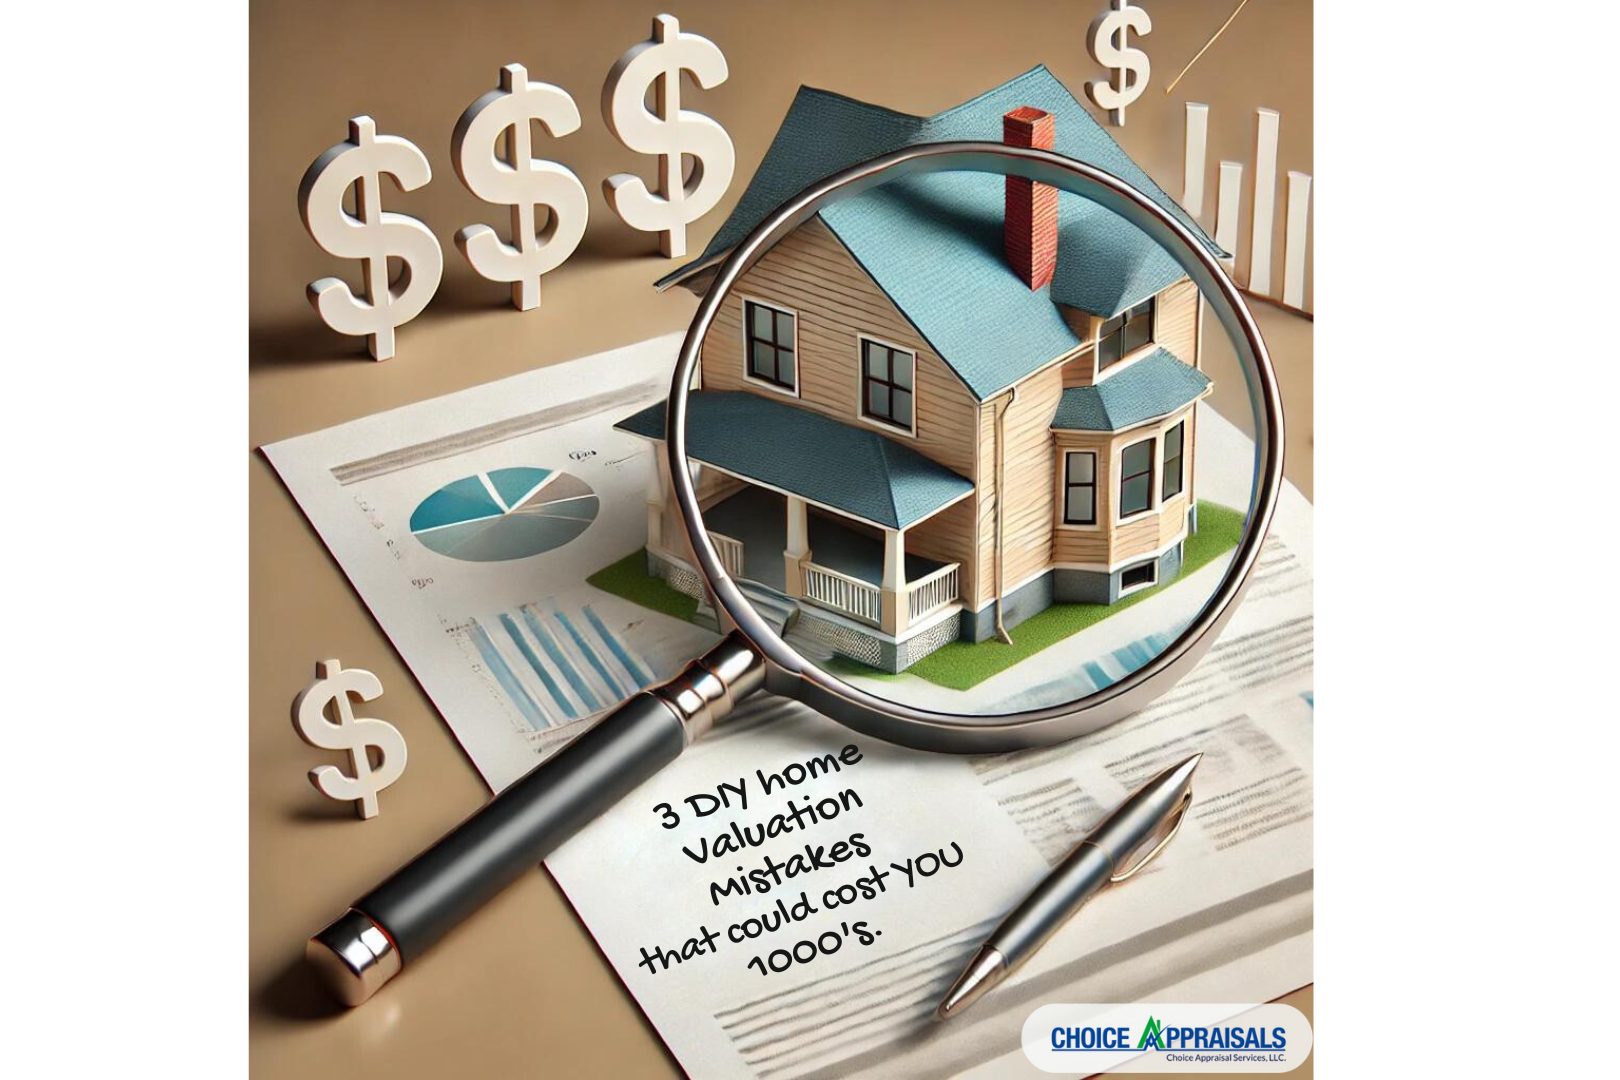
In our fast-paced world, everyone craves value—and we want it instantly. But when it comes to your home’s value, quick fixes aren’t always the best solution.
I’ve previously discussed the pros and cons of online calculators, but today, let’s explore three critical reasons why DIY valuations can be risky:
- Failing to Identify the Underlying Problem
- Lack of Access to Comprehensive Data
- Insufficient Analytical Skills and Tools
These three pitfalls are interconnected—missing the underlying problem leads to misinterpreting the data, which then compounds the errors in your valuation. Let’s delve into each of these in more detail.
1. Missing the Underlying Problem

This might sound surprising, but every house has a “problem” that impacts its value—even brand new ones. By “problem,” I’m referring to a valuation question that must be uncovered to determine the true worth of the property.
For instance, I was once asked to appraise a new construction home in a mature neighborhood where no new homes had been built within a half-mile radius for three years. The key question—or problem—was, “How does the lack of recent new construction sales in the area affect this home’s value?”
Identifying the underlying problem is crucial because it shapes the entire valuation approach. Questions like, “When was the last new construction sale in this area?” or “Are there similar new constructions nearby?” become central.
Without pinpointing the problem, a DIY valuation will likely miss the mark, leading to a flawed estimate.
2. Lack of Access to Comprehensive Data

Where do most people turn for home sale data? Sites like Zillow are common, but they often provide incomplete information.
Realtors have access to gold mines like the Multiple Listing Service (MLS) and Property Valuation Administrator (PVA) websites, which offer more extensive data, especially for unique properties like new constructions.
However, simply accessing data isn’t enough; knowing how to extract and interpret it is key. Early in my career, I made the mistake many DIYers make today—relying on a few neighborhood sales to determine value.
But it’s vital to understand the highs and lows of the market area before drawing conclusions. A DIY valuation might overestimate a property’s value, missing critical market trends that indicate the area can only support 80% of the DIY estimated price.
3. Insufficient Analytical Skills and Tools

Data analysis is where many DIY valuations fall short. Imagine trying to assess a neighborhood with 200 recent sales—how do you determine which ones are relevant? Should some sales be excluded? What are the quarterly price trends?
These questions may significantly influence the final value and answering them requires more than just raw data—it requires the right tools and expertise.
Online resources might offer broad figures, like the median sales price for homes in Louisville, but Louisville has over 100 neighborhoods, each with its own unique market. Without the ability to analyze data specific to your home’s market area, a DIY valuation is bound to be inaccurate.
Wrap-up
In summary, DIY home valuations often fall short because they miss critical steps that professional appraisers never overlook. First, they fail to identify the underlying problem that drives the property’s true value. Without pinpointing this, the entire valuation process is compromised from the start.
Second, they lack access to comprehensive data that realtors and appraisers use to make informed decisions.
Lastly, even when data is available, DIYers often don’t have the tools or expertise needed to analyze it properly, leading to inaccurate and potentially costly errors.
As an appraiser, I approach each property with a well-honed process that starts with identifying the key valuation question, gathering and analyzing data from multiple trusted sources, and using advanced tools to ensure every factor is considered.
My 20+ years of experience, coupled with continuous learning and adaptation, allows me to deliver precise, reliable valuations that help you make informed decisions and maximize your property’s value.
If you’re serious about understanding your property’s true worth and making the most informed decisions possible, skip the DIY route. Let me provide you with a comprehensive appraisal that gives you the confidence to move forward without leaving money on the table.
Ready to get started? Contact me today to schedule a professional appraisal and ensure you’re making the best decisions for your property. Your home is one of your most significant investments—let’s make sure you treat it as such.
by Conrad Meertins | Aug 12, 2024 | Valuation

We all obsess over condition—whether it’s the state of our bodies, our cars, or our homes. But when it comes to our homes, does obsession really matter? Sometimes, we get so fixated on the imperfections that we forget the bigger picture, especially when the market conditions take the driver’s seat.
Today, I want to share some observations on how a home’s condition influences its ability to sell, particularly in different market scenarios. By the end, you’ll see how I, as an appraiser, account for condition when preparing reports.
Condition in a Seller’s Market

In a seller’s market, where inventory is low and demand is high, condition still matters, but it’s not always the deal-breaker you might think. Buyers are often so eager to secure a home that they’re willing to overlook flaws and even pay a premium for properties that wouldn’t ordinarily justify such prices.
Why? It all comes down to competition. Think of an auction—when everyone wants the same item, the bidding war pushes prices up, even if the item isn’t perfect. Similarly, in a hot market, buyers are more likely to bid on a home, even if it’s not in pristine condition.
This is where knowing the market environment becomes crucial. If you’re a seller, having a trusted appraiser or realtor who understands the market dynamics can give you a significant edge.
Pro Tip for Realtors: While the market may allow for higher asking prices, be careful not to overestimate. The appraiser still needs to justify the price based on comparable sales, so ensure there are similar homes in the area that have sold for similar prices despite their condition.
Condition in a Buyer’s Market
Now, let’s flip the script. In a buyer’s market—high inventory, low demand—buyers can afford to be picky. This is when condition becomes a critical factor in a home’s saleability. Just to clarify, we’re not in a buyer’s market right now, so don’t get too excited. But if we were, the scenario would be quite different.
Imagine walking into a burger joint where a cheeseburger and a sirloin steak are the same price. Which would you choose? Most would opt for the steak, of course!
In this analogy, the steak represents a home in great condition, while the cheeseburger is a home that needs some work. Both are listed at similar prices, but with no competition, buyers will naturally gravitate toward the better option.
For Sellers: In such a market, if your home is in less-than-perfect condition, be prepared to adjust your asking price to make it more appealing. Remember, when buyers have options, they’re likely to go with the one that offers the best value.
Accounting for Condition in an Appraisal Report

So, how do I, as an appraiser, adjust for condition? Let me walk you through one of my methods. When appraising a property, I start by defining criteria that help me find comparable homes on the market.
For instance, if I’m appraising a 1,000-square-foot, 3-bedroom, 1-bathroom ranch-style home, I’ll look for similar homes that sold within the past year, within a mile of the subject property.
In a densely populated area, this approach should yield around 30 comparable homes. Next, I analyze their condition via the local MLS, assigning each a condition rating (Fair, Average, Avg/Good, Good). Once I have this data, I create a pivot table that gives me the median sale price for each condition category.
Here’s an example of what the data might look like:
|
Condition
|
Median Sale Price
|
| Fair |
$160,000 |
| Average |
$190,000 |
| Avg/Good |
$210,000 |
| Good |
$250,000 |
This table tells me that in this market, buyers are willing to pay $20,000 more for a home in Avg/Good condition compared to one in Average condition, and $60,000 more for a home in Good condition. This is a defensible, market-driven approach to account for condition when setting a list price or producing an appraisal report.
Conclusion
As you can see, condition is important, but the type of market you’re in dictates how important it is. In a seller’s market, it’s less of a factor; in a buyer’s market, it’s crucial. By analyzing similar homes, you can quantify just how much more (or less) someone might pay based on condition.
The bigger the sample size, the more reliable the analysis. I aim to gather at least 30 homes to ensure that my clients receive market-based evidence on how condition affects sales price.
So, the next time you think about a home’s condition, consider the market first. Act with knowledge, consult with a trusted appraiser, and set your price accordingly—don’t let condition become an obstacle to selling your home.
by Conrad Meertins | Aug 6, 2024 | Valuation

In the fast-paced (sometimes slow-paced) world of real estate, determining your property’s value is crucial to making informed decisions. Whether you’re selling, buying, or refinancing, understanding your property’s worth can significantly impact your financial outcomes.
This leads to the question: should you rely on a Comparative Market Analysis (CMA) or a Pre-listing Appraisal Report?
Both CMAs and pre-listing appraisals offer valuable insights into property valuation, yet they serve distinct purposes and rely on different methodologies.
This post will examine the key differences between these two approaches, highlighting their unique strengths and offering guidance on when to use each tool effectively.
By the end of this read, you’ll be equipped with the knowledge to choose the best option for your real estate needs, ensuring a strategic approach to your property’s valuation.
Understanding Comparative Market Analysis (CMA)

In the world of real estate, a Comparative Market Analysis (CMA) is a vital tool for both buyers and sellers. It offers a snapshot of the local market, allowing homeowners to gauge the potential selling price of their property. But what exactly is a CMA, and how does it work?
Definition
According to Investopedia, “A comparative market analysis (CMA) estimates a home’s price based on recently sold, similar properties in the immediate area.”
Real estate agents and brokers generate CMA reports to assist sellers in setting competitive listing prices and to help buyers make informed offers. These reports rely on data from homes similar to the subject to paint a picture of the current market conditions.
Key Features
CMAs primarily focus on selecting homes comparable to the subject property. Real estate agents utilize a mix of recent sales, active listings, and expired listings to establish a competitive price range.
This analysis is rooted in real-time market data, reflecting the dynamic nature of real estate. By examining similar properties in terms of size, location, condition, and features, agents can craft a well-rounded estimate of the property’s market value.
Key Elements of a CMA:
-
- Recent Sales: Provides a baseline of what buyers are willing to pay for similar properties.
-
- Active Listings: Shows the current competition and helps position the property strategically.
-
- Expired Listings: Offers insights into price points that didn’t attract buyers, aiding in avoiding overpricing pitfalls.
Strengths
CMAs are particularly valued for their quick and cost-effective nature. They allow real estate agents to set initial listing prices efficiently, which can be crucial in fast-moving markets.
The strengths of CMAs lie in their ability to attract potential buyers by offering a competitive price right from the start. By making informed pricing decisions based on data and trends, agents can enhance the appeal of the property to potential buyers.
Ideal Scenarios for CMAs
CMAs shine in scenarios where a homeowner needs a quick assessment of their property’s market position. They are most effective in areas where properties share similarities, allowing for more accurate comparisons.
Additionally, when an agent’s local expertise can be leveraged, a CMA becomes an invaluable tool in crafting a market strategy that resonates with prospective buyers.
When to Use a CMA:
-
- Quick Assessments: Ideal for sellers needing a rapid overview of market conditions and pricing.
-
- Homogeneous Markets: Effective in neighborhoods with similar properties, providing reliable comparative data.
-
- Agent Expertise: Leveraging an agent’s knowledge of the local market nuances can refine CMA results.
Example Scenario
Imagine a homeowner in a suburban neighborhood with many similar three-bedroom houses. They decide to sell their home and need to determine a competitive asking price.
A CMA allows their real estate agent to quickly analyze recent sales and active listings in the area, providing the homeowner with a realistic price range to attract buyers. This swift analysis ensures the property is neither underpriced nor overpriced, maximizing the chance for a successful sale.
Exploring Pre-listing Appraisal Reports

While Comparative Market Analyses (CMAs) provide a quick snapshot of the real estate landscape, pre-listing appraisals offer a more detailed and structured valuation. For homeowners seeking precision, especially in complex scenarios, understanding the benefits of a pre-listing appraisal is crucial.
Definition
A pre-listing appraisal is a comprehensive valuation conducted by a licensed appraiser, designed to provide an in-depth analysis of a property’s market value before it hits the market.
Unlike CMAs, which are typically performed by real estate agents, appraisals are carried out by licensed professionals who adhere to rigorous standards of USPAP (Uniform Standards of Professional Appraisal Practice) to assess a property’s worth accurately.
Key Features
Market Analysis
Appraisal reports delve deeply into the subject’s market, evaluating trends such as increasing, stable, or declining sold home rates.
Each appraisal report includes a thorough market analysis, offering a broader perspective that accounts for economic factors, local developments, and other market influences. This comprehensive approach ensures that the property’s valuation is well-grounded in the current market context.
Adjustments
Appraisers conduct meticulous analyses to adjust for differences between the subject property and comparable sales. This involves accounting for unique features, such as extra square footage, high-end finishes, or custom-built amenities, providing a more precise valuation.
Adjustments are made to ensure the subject property is accurately compared to others, considering all aspects that may affect its value. It should be noted that appraisal reports are required to have support for how all of its adjustments were derived.
Comparable Selection Criteria
Unlike CMAs, appraisal reports are bound by stringent requirements. Financial institutions often require appraisers to “bracket” the subject’s features, ensuring a balanced and accurate comparison.
This process involves selecting comparables that have slightly more or less desirable features than the subject, thereby offering a more reliable valuation metric (this is only done when the feature in question cannot be matched exactly by a comparable sale).
This bracketing technique helps demonstrate the acceptability of certain features within the market, reinforcing the appraiser’s conclusions. For example, if the subject has a 5 car garages. If a comparable cannot be found with a 5 car garage, at least one with less than five cars and one with more than 5 cars would be included.
Strengths
Pre-listing appraisals are known for their precision and credibility. They provide a detailed property value assessment that can be crucial in setting a realistic list price, especially in unique markets or for high-value properties.
The strengths of pre-listing appraisals lie in their ability to deliver objective, third-party evaluations that homeowners and buyers can trust.
Ideal Scenarios for Pre-listing Appraisals
Pre-listing appraisals shine in scenarios requiring accuracy and detail beyond what a CMA can provide. They are ideal for:
-
- Complex Properties: When a homeowner needs an accurate valuation for properties with intricate designs or multiple unique features.
-
- Unique Features: For properties with distinctive attributes where precise valuation is critical to avoid mispricing.
-
- Objective Assessments: In cases where an unbiased third-party evaluation aids in negotiation or helps prevent disputes during sales transactions.
Example Scenario
Consider a homeowner with a custom-built estate featuring specialized architecture, high-end materials, and unique exterior amenities – let’s say a tennis court. For such a property, a pre-listing appraisal is invaluable.
It accounts for all these distinct elements, providing a precise valuation that reflects its true market value. This detailed assessment not only assists in setting the right price but also supports negotiations, ensuring the seller maximizes their property’s worth.
Having explored the intricacies of pre-listing appraisals and their critical role in accurately valuing complex properties, it becomes evident that both CMAs and appraisals offer unique advantages depending on the situation.
In the next section, we’ll conduct a detailed comparison of CMAs and pre-listing appraisals, examining when and why each method should be employed. This comparison will further illuminate the distinct roles these tools play in real estate, helping you make informed decisions tailored to your specific needs.
Detailed Comparison of CMA and Pre-listing Appraisal Report

Choosing between a Comparative Market Analysis (CMA) and a pre-listing appraisal depends on the specific needs of the property owner and the nature of the real estate market.
Both tools provide valuable insights but differ significantly in their approach, depth, and application. This section highlights these differences to help you make informed decisions on when you may use each one.
Market Analysis
Appraisal Reports:
Appraisal reports offer a detailed market analysis that goes beyond the immediate scope of similar homes. They assess broader market trends, evaluate economic indicators, and consider local and regional factors that might influence property values.
This comprehensive analysis provides insights into how a property’s value fits within the larger market context, offering a more holistic view.
CMAs:
CMAs focus primarily on comparable homes, emphasizing recent sales data, active listings, and sometimes expired listings. While this approach effectively provides a snapshot of local market conditions, it may not delve into larger market trends extensively. CMAs rely heavily on the local expertise of real estate agents to interpret this data within the neighborhood context.
Adjustments
Appraisal Reports:
Appraisal reports are renowned for their meticulous adjustments, which account for differences between the subject property and comparable sales.
These adjustments consider factors like additional bathrooms, square footage, architectural features, and more. The process involves detailed analysis and support for how each adjustment was derived, ensuring that every valuation aspect is justified and precise.
CMAs:
In contrast, CMAs often use similar homes with minimal adjustments. The adjustments are generally based on the agent’s expertise and experience rather than extensive researched data.
While effective for initial pricing strategies, this method may lack the precision of an appraisal, especially in cases where unique property features significantly impact value.
Comparable Selection Criteria
Appraisal Reports:
Appraisal reports adhere to specific rules for selecting comparables, including bracketing features. This means choosing comparables that have both fewer and more features than the subject property.
For instance, if the subject property has a three-car garage, appraisers might select one comparable with a two-car garage and another with a four-car garage. This bracketing ensures a balanced comparison and highlights any unique market features, emphasizing that the property’s traits are not anomalies.
CMAs:
CMAs typically focus on recent sales within a specific area or subdivision, sometimes limiting the scope of comparison. While this can be sufficient for standard properties, it may not fully capture the nuances needed for properties with unique features or those located in diverse markets.
When to Use Each
CMA:
-
- Quick Assessments: When a speedy evaluation of the market is needed.
-
- Competitive Pricing: Useful for setting initial list prices in standard neighborhoods in stable markets.
-
- Agent Expertise: Leverages local knowledge and market conditions.
Pre-listing Appraisal:
-
- Precise Valuations: Essential for detailed and accurate property assessments.
-
- Complex Properties: Ideal for unique or high-value properties requiring detailed analysis including market trend analysis.
-
- Objective Analysis: Necessary when an unbiased, third-party evaluation is crucial for negotiations or dispute prevention.
Example Scenario
Imagine a homeowner with a standard single-family home in a suburban neighborhood where there is abundant sales data and many of the homes are similar. In this case, a CMA can quickly establish a competitive price using recent sales data and the agent’s local expertise.
However, consider a property in a historic district with unique architectural elements and custom features. Here, a pre-listing appraisal is invaluable, providing a detailed analysis that accounts for these distinctive characteristics and ensures an accurate valuation.
Summary
Understanding the differences between a Comparative Market Analysis (CMA) and a pre-listing appraisal is essential for anyone navigating the real estate market. CMAs are valuable tools for quick market positioning, offering insights based on comparable home sales that can help set an initial listing price efficiently.
On the other hand, pre-listing appraisals provide precise valuations, especially beneficial for complex or unique properties where detailed analysis is necessary.
Both CMAs and appraisals hold significant value. As a licensed appraiser, I thoroughly respect the CMA process and appreciate when a realtor provides one.
It offers valuable insight into their valuation approach and acts as one piece of the puzzle in the overall appraisal process. Both tools should be respected for their unique strengths and purposes, and both have their rightful place in the real estate industry.
Final Thoughts
While CMAs serve as excellent starting points for setting prices, they are not a substitute for appraisal reports. Appraisers adhere to strict standards like USPAP, delivering a thorough analysis that can be more appropriate for properties with unique features or those located in diverse markets.
Some real estate agents with extensive market experience can provide valuable insights through CMAs, but if your home isn’t a cookie-cutter replica of others in the area, and if the stakes are high, consider hiring an appraiser. This decision can ensure a more precise valuation, offering peace of mind and strategic advantage in negotiations.
And hey, since CMAs are typically free, why not get both? It’s like having a dessert with your meal—just makes everything better!
What to do next…
I encourage readers to carefully evaluate their needs and consult professionals when deciding between a CMA and a pre-listing appraisal. Understanding the nuances of each tool will enable you to make informed decisions and choose the right strategy for your real estate transactions.
Whether you’re selling, buying, or simply curious about your property’s value, selecting the appropriate approach can make a significant difference. To learn more about pre-listing appraisals give me call.
by Conrad Meertins | Jul 22, 2024 | Valuation

Worried that selling your parent’s home might jeopardize their Medicaid benefits? You’re not alone. Here’s how to navigate this tricky situation with confidence and care.
As adult children, managing the care of aging parents often involves making tough decisions, especially when it comes to their homes. One of the most complex areas is understanding how selling a parent’s home intersects with Medicaid eligibility.
Whether you’re a realtor assisting clients or a homeowner facing these challenges yourself, this guide will help demystify the process and provide practical insights.
Understanding Medicaid Eligibility and Asset Limits

The confusion surrounding Medicaid eligibility and home sales can leave families feeling overwhelmed and uncertain about their next steps.
Asset and Income Limits Medicaid has strict asset and income limits. Typically, a person’s primary residence is exempt from Medicaid’s asset calculations as long as the individual or their spouse lives there.
However, once the individual enters a nursing home permanently, the home may no longer be exempt.
Exemptions and the Home
-
- Exempt While Living in the Home: If the individual or their spouse is living in the home, it’s usually considered an exempt asset.
-
- Intent to Return Home: If the individual in the nursing home declares an intent to return home, the home might still be considered exempt.
-
- Community Spouse: If a spouse continues to live in the home, it remains exempt.
Medicaid Estate Recovery

Imagine facing the loss of your family home to Medicaid estate recovery after spending years caring for a loved one.
Medicaid has the right to recover costs from the estate of the deceased Medicaid beneficiary, known as Medicaid Estate Recovery. If the home is sold after the individual’s death, Medicaid can place a lien on the home to recover the costs paid for the individual’s care.
Selling the Home Before or During Medicaid Application

Understanding the timing of selling the home is critical to maintaining Medicaid eligibility and avoiding costly penalties.
-
- Before Applying for Medicaid: Selling the home before applying for Medicaid might disqualify the individual from Medicaid for a period due to the asset transfer. Medicaid has a look-back period (typically five years) to prevent asset transfers meant to qualify for Medicaid.
-
- During Medicaid Application: If the home is sold while the individual is receiving Medicaid, the proceeds from the sale could affect their eligibility, as the funds from the sale might be considered an asset, pushing the individual above Medicaid’s asset limit.
Fair Market Value and Medicaid Compliance

Why Accurate Appraisal Matters The fair market value (FMV) of your parent’s home plays a crucial role in Medicaid. Medicaid requires an accurate appraisal to determine the value of assets.
An inaccurate appraisal—either overestimating or underestimating the home’s value—can lead to significant issues such as penalties or denial of benefits.
Example Scenario:
-
- Appraised Value: $200,000
-
- Best Offer Received: $175,000
In this scenario, Medicaid considers the appraised value of $200,000 when determining eligibility, even if the best offer received is only $175,000.
Implications of Appraised Value on Medicaid Eligibility
-
- Overestimating: If the home’s value is overestimated, it may appear that your parent has more assets, potentially disqualifying them from Medicaid or delaying eligibility.
-
- Underestimating: Underestimating the value can be seen as an attempt to reduce countable assets, which Medicaid might scrutinize, potentially leading to penalties.
Navigating the Medicaid Look-Back Period

Understanding the look-back period can save your family from unexpected penalties and ensure your loved one’s Medicaid eligibility.
Medicaid has a five-year look-back period to prevent asset transfers meant to qualify for Medicaid. If the home is sold for less than its appraised value within this period, the difference might be considered a gift, resulting in penalties.
Example: If the home is appraised at $200,000 but sold for $175,000, Medicaid may view the $25,000 difference as a gift, imposing a penalty period.
Practical Steps for Adult Children and Homeowners

-
- Get an Accurate Appraisal: Ensure the appraisal reflects the true FMV of the property to avoid complications.
-
- Document Everything: If the home sells for less than the appraised value, document the reasons thoroughly to provide to Medicaid if needed.
-
- Consult Professionals: Work with Medicaid planners or elder law attorneys to navigate the sale and its implications for Medicaid eligibility.
Navigating the complexities of home sales and Medicaid can be overwhelming, but you’re not alone. With the right information and careful planning, you can protect your parent’s benefits and make decisions that support their care and well-being.
As realtors and homeowners, staying informed about these processes not only helps in compliance with Medicaid regulations but also ensures the best outcomes for your loved ones.
by Conrad Meertins | Jul 16, 2024 | Valuation

Curious why your 2-4 family property’s appraisal seems so complex? You’re not alone. Many Louisville homeowners and realtors are surprised to discover that multi-family appraisals are a whole different ballgame compared to single-family homes.
But don’t worry – we’re about to unveil the mystery behind 2-4 family home appraisals in the Derby City.
Imagine you’ve just inherited a charming duplex in the Highlands. You’re excited about the potential, but when you mention getting it appraised, your realtor friend looks at you with a mix of sympathy and amusement. “Oh honey,” she says, “you’re in for a wild ride.”
That’s the moment you realize: multi-family appraisals are not just about counting bedrooms and measuring square footage. They’re about unlocking the true potential of your property in Louisville’s dynamic real estate market.
The Multi-Family Appraisal Maze: A Louisville, KY Perspective

In the world of Louisville residential appraisers, 2-4 family properties are the ultimate puzzle. Unlike single-family homes, where appraisers mainly focus on adjusted sales prices of comparable properties, multi-family appraisals dive deeper.
They’re like peeling an onion – layer upon layer of analysis.
Here’s what makes multi-family home appraisals in Louisville unique:

Price per Bedroom: In a city where college students and young professionals are always hunting for rentals, this metric is gold. It helps compare properties with different bedroom counts, crucial in areas near the University of Louisville or Bellarmine University.
Price per Unit: Essential for investors eyeing properties in up-and-coming neighborhoods like Butchertown or NuLu. This metric helps normalize values across duplexes, triplexes, and fourplexes.
Price per Room: Crucial when comparing properties in diverse areas, from Old Louisville to the East End. It accounts for differences in layout and living spaces, which can vary widely in Louisville’s eclectic housing stock.
Price per Gross Building Area (GBA): Vital in a market where historic properties often compete with new developments. This metric helps level the playing field between a renovated Victorian in Crescent Hill and a modern fourplex in the Highlands.
But why does this matter to you? Because understanding these metrics can be the difference between a good investment and a great one in Louisville’s competitive market.
Cracking the Code: How Louisville Appraisers Use These Metrics

Louisville’s top residential appraisers don’t just crunch numbers; they tell the story of your property’s potential. They use these metrics to:
Select the most relevant comparable sales in your neighborhood. In a city as diverse as Louisville, this means finding properties that truly match yours, whether it’s a historic conversion in Old Louisville or a purpose-built multi-family in St. Matthews.
Make precise adjustments that reflect Louisville’s unique market conditions. Our city’s mix of urban, suburban, and historic districts means each area has its own nuances that impact property values.
Provide a rock-solid final valuation that stands up to scrutiny. In Louisville’s fast-moving market, accuracy is key for both buyers and sellers.
For homeowners and realtors in Louisville, this means:

Homeowners: You need to see your 2-4 family property through an investor’s eyes. Keep detailed records of your property’s specifications and rental history. In Louisville’s seasonal rental market, tracking occupancy rates and rental income throughout the year can provide valuable insights.
Realtors: Prepare to become a multi-family property detective. Your ability to analyze and present these metrics can set you apart in Louisville’s competitive real estate scene. Understanding how these metrics vary across different neighborhoods – from the Parklands to Portland – can make you an invaluable resource to your clients.
The Income Approach: A Crucial Component in Louisville’s Multi-Family Appraisals
When it comes to 2-4 family properties in Louisville, the income approach takes center stage. This method looks at your property’s potential to generate rental income – a key factor for investors in our growing city.
Here’s why it matters:
Gross Rent Multiplier (GRM): This quick calculation helps investors compare properties across different Louisville neighborhoods. A lower GRM in an up-and-coming area like Germantown might signal a good investment opportunity.
Capitalization Rate (Cap Rate): This metric is crucial for understanding the potential return on investment. In Louisville’s diverse market, cap rates can vary significantly between established areas like the Highlands and emerging neighborhoods like Schnitzelburg.
Net Operating Income (NOI): This figure accounts for Louisville-specific expenses like property taxes, insurance, and maintenance costs, which can vary widely across the city.
Understanding these income-based metrics can help you make informed decisions in Louisville’s multi-family market, whether you’re looking at a duplex in Clifton or a fourplex in Fern Creek.
Utility Considerations: A Hidden Factor in Louisville Multi-Family Appraisals

In Louisville’s varied housing stock, utility setups can significantly impact a multi-family property’s value. Here’s what you need to know:
Separate vs. Common Utilities: Properties with separate utilities for each unit often command higher valuations in Louisville. They’re particularly attractive in areas with a high concentration of young professionals, like the Highlands or NuLu.
Energy Efficiency: With Louisville’s hot summers and cold winters, energy-efficient properties can command premium rents. Upgrades like new windows or HVAC systems can significantly boost your property’s appeal and value.
Local Regulations: Be aware of Louisville Metro’s regulations regarding utility billing in multi-family properties. Compliance with local laws is crucial for maintaining your property’s value and avoiding legal issues.
Your Next Move in Louisville’s Multi-Family Market

Now that you’re armed with this insider knowledge, what’s your next step? Whether you’re considering buying a duplex in Germantown or selling a fourplex in Clifton, understanding these appraisal secrets gives you an edge.
Here are some actionable steps:
Research Your Neighborhood: Louisville’s neighborhoods each have their own character and market dynamics. Understand how your property fits into the local context.
Keep Detailed Records: Track your property’s rental history, occupancy rates, and any improvements you’ve made. This information is gold for appraisers and potential buyers.
Stay Informed: Louisville’s real estate market is always evolving. Keep an eye on local development plans and market trends that could impact your property’s value.
Consider Professional Management: In a competitive market like Louisville, professional property management can help maximize your property’s potential and value.
Plan for the Future: Whether it’s energy-efficient upgrades or unit reconfigurations, strategic improvements can significantly boost your property’s appraisal value.
Ready to navigate the exciting world of multi-family properties in Louisville? Don’t go it alone. Partner with a Louisville residential appraiser who specializes in 2-4 family home appraisals. They’ll help you unlock the true potential of your property and make informed decisions in our vibrant Louisville market.
Remember, in the world of multi-family properties, knowledge isn’t just power – it’s profit. Are you ready to see your Louisville property in a whole new light? The key to unlocking your property’s true potential is just an appraisal away.
Don’t let the complexity of multi-family appraisals hold you back from making smart investment decisions in the Derby City’s dynamic real estate market.
by Conrad Meertins | Jul 1, 2024 | Valuation

Ever wondered why some luxury homes don’t appraise for what they’re truly worth? In the high-stakes world of luxury real estate, an accurate appraisal can make or break a deal. In the Louisville area, I’ve personally seen differences in value for the same property of over 1 million dollars!
That being said, appraisals for high-end properties come with unique challenges that can impact the final valuation significantly. From custom amenities and unique features to the scarcity of comparable sales, luxury homes require a meticulous and knowledgeable approach.
This article will guide you through the critical steps to ensure that your luxury property is appraised accurately and fairly. We’ll cover everything from selecting the right appraiser to understanding the importance of accurate sketches and cost approaches (the latter two points are especially important when it comes to the appraisal of new or proposed-construction luxury homes.
By following these tips, you can avoid common pitfalls and ensure a smooth home appraisal process that reflects the true value of your luxury home.
Understanding the Unique Challenges of Luxury Appraisals

High Value and Unique Features
Appraising high-value properties presents a unique set of challenges. Luxury homes often come with custom amenities and unique features that significantly impact their value.
These might include state-of-the-art home theaters, expansive wine cellars, private gyms, and elaborate landscaping, among others (I shouldn’t forget the elevator from the basement to the second floor in some homes!). Each of these features needs to be evaluated not just for its cost but also for how it contributes to the overall appeal and functionality of the property.
The challenge lies in the subjective nature of these features. What one buyer might consider an invaluable addition, another might see as unnecessary.
Therefore, it’s crucial for the appraiser to have a deep understanding of the luxury market and the specific value that these custom amenities add. They must assess how these features compare to other high-end homes, both in terms of functionality and desirability.
Limited Comparables
Finding comparable sales, or “comps,” is another significant hurdle in the appraisal of luxury properties. For example, here in Louisville, KY only 13 homes have sold over $2,000,000 this year.
The uniqueness of high-end homes often means there are fewer similar properties recently sold in the area. This lack of comparable sales can make it difficult to establish a market value based on recent transactions.
Luxury homes are often distinct in style, design, and amenities, which makes direct comparisons challenging. For instance, a Mediterranean-style villa with a view of the Ohio River, and a modern mansion with a private golf course may both be luxury properties, but their features and appeal can differ dramatically.
Additionally, market trends can have a pronounced effect on luxury property values. Economic shifts, changes in buyer preferences, and fluctuations in the high-end real estate market can all influence how comparable properties are valued.
A home appraiser needs to be well-versed in these trends and able to adjust their valuations accordingly.
In summary, the unique challenges of luxury appraisals stem from the high value and distinctive features of these properties, along with the difficulty in finding comparable sales.
Appraisers must navigate these challenges with a deep understanding of the luxury market, ensuring that each unique feature is accurately valued and that the lack of direct comparables is effectively managed. This nuanced approach helps in arriving at a fair and accurate appraisal, reflecting the true worth of the luxury property.
Preparing Your Property for Appraisal

So what information should you gather to provide to the appraiser? Proper preparation can significantly influence the appraiser’s perception and the final valuation of your luxury property.
Documentation and Information
Providing comprehensive and detailed documentation is crucial for a thorough appraisal. Here’s what you need to gather:
- Property’s History: Include any pertinent information about the property’s past, such as previous sales, historical significance, or unique events.
- Renovations and Upgrades: Document all renovations and upgrades made to the property. This should include dates, costs, and detailed descriptions of the work done. Highlight high-end materials and custom features.
- Unique Features: Outline any unique features that set the property apart from others. This could include custom-designed elements, smart home technology, eco-friendly installations, or rare architectural details.
- Blueprints and Floor Plans: Offer original blueprints and updated floor plans to assist in verifying the accuracy of the property’s layout and dimensions.
- Legal Documents: Include any relevant legal documents, such as title deeds, zoning information, and homeowners association (HOA) regulations.
Selecting the Right Appraiser

Ensuring that your luxury property is accurately valued also depends significantly on selecting the right appraiser. An appraiser with the right experience, expertise, and local market knowledge can provide a more accurate appraisal.
Experience and Expertise
Hiring an appraiser who has specific experience in luxury properties is crucial. Luxury homes have unique features and characteristics that require a specialized understanding to appraise correctly.
-
- Importance of Experience: An experienced appraiser will be familiar with the intricacies and nuances of high-end properties, such as custom-built features, high-quality materials, and unique architectural elements. They understand how these aspects contribute to the overall value of the property.
-
- Credentials to Look For: When selecting an appraiser, it’s essential to consider their credentials. Look for professionals who are certified and have affiliations with reputable industry organizations.
Local Market Knowledge
In addition to experience and credentials, it’s vital to choose an appraiser who has in-depth knowledge of the local luxury market. Local expertise can significantly impact the accuracy of the appraisal.
-
- Familiarity with Local Market: An appraiser who is well-acquainted with the local luxury real estate market in Louisville will have a better understanding of the factors that influence property values in the area. This includes current market trends, buyer preferences, and the economic landscape.
-
- Benefits of Local Expertise: Appraisers with local market knowledge can more accurately assess how specific features and amenities of your property compare to other high-end homes in the area. They can also provide a more precise valuation by considering local comparables and recent sales data, which are critical in the appraisal process.
Selecting an appraiser with the right blend of experience, expertise, and local market knowledge ensures a thorough and accurate appraisal of your luxury property. By focusing on these qualifications, you can have greater confidence in the appraised value, facilitating a smoother transaction process and helping to achieve a fair market valuation.
Ensuring Accurate Property Sketches

A critical step in the appraisal process is ensuring accurate property sketches. This step is vital as it directly impacts the Gross Living Area (GLA), which is a fundamental metric in determining a property’s value. Your appraiser cannot afford to drop the ball in this area!
Creating the Appraiser’s Own Sketch
In the case proposed construction, the builder will often provide detailed drawings and specifications of a property, However, it is essential for the appraiser to create their own sketch.
The builder’s drawings can be an excellent starting point, but they might not always adhere to appraisal standards or may include spaces that shouldn’t be counted as living areas. By creating an independent sketch, the appraiser can ensure that all measurements are accurate and meet the standards set forth by appraisal guidelines.
Ensuring the Gross Living Area (GLA) Excludes Non-Living Spaces
One of the most critical aspects of an accurate property sketch is correctly calculating the Gross Living Area (GLA). The GLA should only include spaces that are actually livable.
This means excluding areas such as attics, garages, and porches, which do not conform to the American National Standards Institute (ANSI) guidelines for living spaces. Including these areas can lead to an inflated GLA, which can subsequently result in an inaccurate property valuation.
Real-life Example
Consider a real-life example where a luxury home’s garage was included in the builder’s reported living area. In this case, the initial appraisal based on the builder’s drawings overestimated the property’s value because the garage space was mistakenly counted as part of the living area.
The appraiser, by creating their own sketch and excluding the non-living spaces, corrected this discrepancy. This not only provided a more accurate valuation but also prevented potential disputes or issues during the sale process.
Catching such discrepancies is crucial for several reasons:
-
- Accurate Valuation: Ensures that the property’s value is based on its actual livable space, leading to a fair and precise appraisal.
-
- Client Trust: Builds trust with clients who rely on the appraiser’s expertise and thoroughness.
-
- Market Consistency: Helps maintain consistency in the real estate market by adhering to standard valuation practices.
By creating their own sketches and meticulously ensuring that the GLA excludes non-living spaces, appraisers can provide more reliable and accurate property valuations. This practice not only upholds professional standards but also supports the integrity of the appraisal process, ultimately benefiting all parties involved in the transaction.
Getting the Cost Approach Right

After ensuring the GLA is accurate, a next crucial step is getting the cost approach right. This method involves estimating the current cost to replace the property with a similar one, adjusting for depreciation, and adding the land value. For luxury properties, this approach can be particularly complex due to the high-quality materials and custom features involved.
Reliable Cost Estimator
Using a reliable cost estimator is essential in the cost approach to ensure accuracy. Luxury homes often include bespoke elements and premium materials that require precise valuation. A reliable cost estimator will consider all these factors, providing a detailed breakdown of costs.
It’s important to enter the correct components when using a cost estimator. This includes everything from the type of flooring and countertops to the quality of fixtures and appliances.
Each component must be accurately recorded to reflect the true cost of replicating the property’s unique features. Indicating the appropriate quality for each element ensures that the final estimation is not just a sum of average costs but a true representation of the property’s value.
Avoiding Common Pitfalls
One of the most common mistakes in the cost approach, especially in the case of new or proposed construction, is simply taking the owner’s word on what it cost to build or the appraiser making the cost approach match what the builder said it costs. This can lead to inaccurate appraisals if the reported costs are not thoroughly vetted and verified.
-
- Verify Builder’s Costs: The appraiser should use the materials, finishes, and quality indicated by the builder to develop an accurate cost approach using recognized and accurate cost manuals. This involves a detailed analysis of each element to ensure it meets the high standards of luxury properties.
-
- Discuss Discrepancies with the Builder: Where there are differences in costs, the appraiser can talk with the builder to see if anything was overlooked. This conversation can help identify any discrepancies or additional costs that may not have been initially considered.
-
- Beware of Inflated Costs: In some rare cases, it may be that the builder’s costs are inflated. The appraiser must be vigilant and ensure that the cost approach reflects the true market cost of materials and labor. Relying solely on the builder’s reported costs without independent verification can lead to an overvaluation of the property.
Ensuring that the cost approach is comprehensive and accurate involves avoiding these pitfalls and using a methodical, detailed approach to valuation. By using a reliable cost estimator, verifying builder’s costs, and addressing any discrepancies, appraisers can provide a precise and fair valuation of luxury properties. This diligence helps in achieving a realistic appraisal, benefiting all parties involved in the real estate transaction.
Final Inspection and Verification

When dealing with a luxury property that was initially appraised as proposed construction and has now been completed, conducting a final inspection and verification is crucial. This step ensures that the completed property aligns with the initial plans and meets the standards set during the initial appraisal.
Measuring the Property
One of the primary tasks during the final inspection is to measure the property accurately.
-
- Importance of Measuring: Accurate measurements are essential to confirm that the dimensions of the completed property match those recorded in the initial appraisal. Any discrepancies can impact the appraised value and must be addressed to ensure a fair and accurate valuation.
-
- Ensuring Dimensions Match the Original Sketch: During the final inspection, the appraiser should measure all areas of the property to verify that they conform to the original sketch provided during the initial appraisal.This includes checking the Gross Living Area (GLA) and ensuring that all measurements are consistent with what was originally reported. Any significant variations should be noted and adjusted in the final appraisal report.
Checking Finished Areas
Another critical aspect of the final inspection is to verify that all areas of the property, especially those designated as finished in the initial appraisal, are indeed completed as specified.
-
- Verifying Finished Basements and Other Areas: The appraiser should inspect areas like basements, attics, and additional rooms to confirm they are finished as described.For example, if the initial appraisal included a finished basement, the appraiser must check that the basement is fully completed, with all necessary features and finishes in place.
-
- Impact on Appraised Value: Ensuring that all areas are finished as initially appraised is vital for an accurate final valuation. If any areas are not completed as expected, this can lead to adjustments in the appraised value.For instance, an unfinished basement that was supposed to be finished will lower the overall value of the property compared to the initial appraisal.
Conducting a thorough final inspection and verification ensures that the completed luxury property meets the standards set during the initial appraisal. This step is essential for confirming that all measurements and finished areas align with the initial plans, leading to an accurate and fair final appraisal.
This diligence helps avoid potential disputes and ensures a smoother transaction process, reflecting the true value of the luxury property.
Common Pitfalls and How to Avoid Them

Even with the best intentions and efforts, there are common pitfalls that can undermine the accuracy of a luxury property appraisal. Recognizing these pitfalls and knowing how to avoid them is crucial for ensuring a fair and precise valuation.
Overestimating Value
One of the most frequent issues is overestimating the value of a property.
-
- Avoiding Unrealistic Expectations: It’s easy for owners and appraisers to fall into the trap of overestimating the value based on emotional attachment or personal opinions about the property.Luxury properties often have sentimental value and unique features that owners believe should significantly increase the property’s worth. However, these subjective views can lead to inflated valuations.
-
- Relying on Objective Market Data: To avoid this pitfall, appraisers must rely on objective market data rather than personal opinions. This includes analyzing recent sales of comparable properties, understanding the market trends, and considering the actual demand for similar luxury homes.An unbiased approach helps in arriving at a realistic value that reflects true market conditions.
Ignoring Market Conditions
Another major pitfall is ignoring or not fully understanding current market conditions.
-
- Understanding Market Trends: The luxury real estate market can be highly volatile, influenced by economic factors, buyer preferences, and local market dynamics. Ignoring these trends can lead to inaccurate valuations.Appraisers need to stay informed about the latest developments in the luxury market and adjust their assessments accordingly.
Lack of Preparation
Insufficient preparation is another common issue that can adversely affect the appraisal process.
-
- Consequences of Insufficient Preparation: Lack of thorough preparation can lead to missed details, overlooked features, and ultimately, an inaccurate valuation. For luxury properties, where every detail can significantly impact the overall value, this can be particularly detrimental.
-
- Steps to Ensure Thorough Preparation: To avoid this pitfall, appraisers should take several preparatory steps:
- Gather Detailed Information: Collect all necessary documents, including blueprints, tax records, renovation histories, and unique feature descriptions.
- Conduct a Preliminary Analysis: Before the on-site visit, perform a preliminary analysis of the property and the market to identify key areas of focus.
-
- Thorough Property Inspection: During the inspection, meticulously document all features, take accurate measurements, and verify that all aspects of the property match the initial information provided.
-
- Engage with the Property Owner: Communicate with the property owner/builder to clarify any uncertainties and gather additional insights that may not be immediately apparent.
By recognizing and addressing these common pitfalls, appraisers can ensure a more accurate and fair valuation of luxury properties. Avoiding overestimation, understanding market conditions, and preparing thoroughly for the appraisal process are critical steps in achieving a precise and reliable appraisal outcome.
Conclusion
In summary, accurately appraising luxury residential properties requires a thorough and meticulous approach. Here are the key points we’ve covered:
Understanding the Unique Challenges of Luxury Appraisals:
-
- High-value properties have unique features that significantly impact their value.
- Finding comparable sales is challenging due to the distinctiveness of luxury homes.
- Market trends can heavily influence the valuation of luxury properties
Preparing Your Property for Appraisal:
-
- Gather comprehensive documentation, including property history, renovations, unique features, blueprints, and legal documents.
- Ensure the property’s presentation highlights it’s luxury features.
Selecting the Right Appraiser:
-
- Choose an appraiser with specific experience in luxury properties and relevant credentials.
- Ensure the appraiser has in-depth knowledge of the local luxury market for an accurate valuation.
Ensuring Accurate Property Sketches:
-
- Appraisers should create their own sketches to ensure accuracy and adherence to appraisal standards.
- Exclude non-living spaces from the Gross Living Area (GLA) to avoid inflated valuations.
Getting the Cost Approach Right:
-
- Use a reliable cost estimator and verify the builder’s reported costs.
- Ensure the cost approach reflects true market costs by avoiding inflated or unverified figures.
Final Inspection and Verification:
-
- Measure the property accurately and ensure dimensions match the original sketch.
- Verify that all designated finished areas are completed as specified in the initial appraisal.
Common Pitfalls and How to Avoid Them:
-
- Avoid overestimating value by relying on objective market data and understanding current market conditions.
- Prepare thoroughly for the appraisal by gathering detailed information, conducting preliminary analysis, and engaging with the property owner.
By implementing these tips, you can ensure a successful appraisal experience that accurately reflects the true value of your luxury property. This diligence not only supports fair and precise valuations but also fosters trust and smooth transactions.
Remember, a meticulous approach to appraisals is crucial in the high-stakes world of luxury real estate, and adhering to these best practices will help you achieve the most accurate and fair outcomes. If you’ve found value from this article, please share it with a colleague or anyone you think would benefit. Thanks for reading!
by Conrad Meertins | Jun 24, 2024 | Uncategorized

Ever wondered how appraising a charming Victorian mansion differs from a modern suburban home? Historical properties offer unique challenges and opportunities in the appraisal process.
The allure of these properties lies in their rich history and architectural beauty, making them more than just real estate—they’re pieces of history.
This article delves into the intricacies of appraising historical properties, highlighting the unique factors that affect their value.
From understanding their historical significance to navigating regulatory hurdles, we’ll guide you through the essential aspects of this specialized field.
By mastering the art of appraising historical properties, you’ll be better equipped to preserve their legacy while ensuring accurate valuations. Join me as we uncover the fascinating world of historical property appraisals and equip yourself with the knowledge to navigate this rewarding yet challenging domain.
Understanding Historical Properties

Understanding historical properties begins with recognizing what qualifies them as historical. These properties, often at least 100 years old, possess architectural, cultural, or historical significance.
For instance, a Victorian mansion built in the 19th century may feature intricate woodwork and original stained glass, representing the craftsmanship of its era.
Historical properties are often listed on registers like the National Register of Historic Places, which not only acknowledges their significance but can also provide tax incentives for preservation.
The historical significance can elevate a property’s value, but it also demands careful maintenance and adherence to preservation standards.
Consider the Conrad-Caldwell House in Louisville, KY, an exquisite Richardsonian Romanesque mansion. It stands as a testament to meticulous preservation and historical integrity.
For appraisers, understanding these elements is crucial. It involves assessing not just the physical attributes but also the historical context, making it essential to approach these appraisals with a blend of historical knowledge and technical expertise.
Unique Factors Influencing Appraisal Values

Appraising historical properties involves unique factors that significantly influence their values. Historical significance is a primary factor, as properties associated with notable events or figures can command higher appraisals.
Imagine the birthplace of a famous author or a building pivotal in a historic event—its unique story can greatly increase its value.
Architectural integrity also plays a crucial role. Properties retaining original features like period-specific woodwork, stained glass, or original facades often appraise higher.
Take the Brennan House in Louisville, KY, for example. It’s a prime illustration of preserved Victorian architecture and original furnishings, adding significant value.
Location and context further impact value. Properties situated in well-preserved historical districts or near other landmarks tend to appraise higher. A historic home in Old Louisville, with its prestigious location and historical surroundings, is a perfect example of this.
These unique factors require appraisers to combine historical insight with market analysis to accurately determine the value of historical properties.
Challenges in Appraising Historical Properties

Appraising historical properties presents several challenges. One major hurdle is the lack of comparable properties. Unlike modern homes, historical properties are unique, making it difficult to find similar sales for accurate comparisons.
Imagine trying to find recent sales of an 18th-century Georgian mansion—it’s not easy, and this complicates value estimation.
Condition and restoration needs are also significant challenges. Historical properties often require extensive maintenance and preservation, impacting their appraised value.
The cost of restoring original features, such as hand-carved woodwork or vintage stained glass, can be substantial. Restoring the woodwork in a Victorian home, for example, can cost tens of thousands of dollars.
Regulatory and zoning issues further complicate appraisals. Properties in historical districts may face strict preservation laws limiting alterations. These restrictions can deter potential buyers, affecting market value.
Understanding these challenges is crucial for accurate appraisals, requiring appraisers to blend historical knowledge with practical considerations of maintenance and legal constraints.
Appraisal Methods for Historical Properties
Appraising historical properties necessitates specialized methods to capture their unique value. The Sales Comparison Approach involves comparing the historical property to similar ones that have recently sold, but finding adequate comparables can be challenging.
Adjustments must be made for unique historical features. For example, a Civil War-era house in Louisville might be compared with other historic homes in the area, factoring in its age, condition, and historical significance.
The Cost Approach estimates the value based on the cost to replicate the property, accounting for depreciation. This method is beneficial for properties with significant restorations.
Estimating the cost to restore a Victorian mansion in Old Louisville to its original state helps determine its value by considering both the replacement cost and depreciation.
The Income Capitalization Approach is useful for historical properties generating income, like converted bed-and-breakfasts (if zoning permits). This method assesses the property’s value based on its income potential, factoring in operating expenses and expected returns.
Understanding these appraisal methods allows for accurate valuations, ensuring historical properties are appraised with their unique characteristics in mind.
Best Practices for Realtors Working with Historical Properties

Realtors working with historical properties should follow best practices to ensure accurate appraisals and successful transactions. First, gathering comprehensive documentation is essential. This includes historical records, previous appraisals, and architectural plans. Collaborating with local historical societies can provide invaluable insights and data.
Preparing the property for appraisal involves highlighting its unique features. Ensure that original elements like period-specific woodwork or stained glass are showcased. Addressing necessary repairs while preserving historical integrity can positively impact the appraisal.
Effective communication with appraisers is crucial. Providing detailed information about the property’s historical significance and any relevant restorations can aid the appraiser’s understanding.
For example, detailing the preservation efforts of a restored Victorian home in Old Louisville helps convey its value.
Networking with preservationists and historical experts can also provide support and additional resources. By following these best practices, realtors can better navigate the complexities of historical property transactions, ensuring accurate appraisals and client satisfaction.
Conclusion
In summary, appraising historical properties requires a nuanced approach that blends historical insight with technical appraisal methods. Key factors influencing value include historical significance, architectural integrity, and location context.
These unique aspects, coupled with challenges like limited comparables, restoration needs, and regulatory constraints, make appraisals complex. Employing methods such as the Sales Comparison, Cost, and Income Capitalization approaches ensures accurate valuations.
For realtors, best practices include gathering thorough documentation, highlighting unique features, effective communication with appraisers, and collaboration with historical experts.
By mastering these practices, realtors can provide precise valuations and expert guidance, navigating the complexities of historical property appraisals.
This not only preserves the legacy of historical properties but also enhances professional credibility and client trust. Understanding and applying these principles is essential for success in appraising and selling historical properties.
by Conrad Meertins | Jun 20, 2024 | Uncategorized

Have you ever wondered how your privacy is protected during a real estate appraisal? Confidentiality isn’t just a courtesy—it’s a critical necessity in the real estate industry. Imagine the peace of mind knowing every detail about your property is handled with the utmost care and discretion. Confidentiality ensures that sensitive information remains secure, fostering a trustworthy relationship between appraisers and clients.
This article will explore why confidentiality is paramount, the standards appraisers adhere to, and how safeguarding your personal data protects your interests. Understanding these aspects will help you appreciate the professionalism behind the scenes and the importance of protecting your information for a smooth and secure real estate transaction.
Importance of Confidentiality

Confidentiality is crucial in real estate appraisals for building trust between clients and appraisers. According to the Uniform Standards of Professional Appraisal Practice (USPAP), appraisers are required to maintain confidentiality, reinforcing the importance of privacy in the appraisal process.
People often ask me if the report will be shared with the county assessor, thus causing their taxes to go up, or if it will go to the IRS. The report is prepared for the client and is only shared with those identified by the client as intended users or when required to do so by law.
For example, if an appraiser discloses a client’s financial details or property specifics without permission, it could lead to identity theft or financial fraud. A breach of confidentiality can also damage an appraiser’s reputation and result in legal consequences. Moreover, confidentiality is essential for maintaining market integrity. If confidential information is leaked, it could influence property values and distort the market.
By prioritizing confidentiality, appraisers not only comply with ethical standards but also uphold the integrity and trust necessary for fair and accurate real estate transactions.
Standards and Practices

The Uniform Standards of Professional Appraisal Practice (USPAP) outlines strict guidelines that appraisers must follow to ensure client information remains secure. These guidelines mandate that appraisers keep all information about the property, the client, and the appraisal itself confidential, unless legally obligated to disclose it.
Fortunately, major technology providers like Microsoft and Google incorporate robust security features into their products to help maintain confidentiality. For instance, Microsoft 365 offers built-in security measures, and Gmail uses technology to keep your emails secure. Even WhatsApp now has encrypted communication to protect your messages. In this world of data breaches, it’s reassuring to know that the big players are taking serious measures. However, it is still important to use good judgment and be careful when using these tools.
Appraisers can also use password management tools like LastPass to create and store complex passwords securely. This minimizes the risk of unauthorized access to sensitive information.
By adhering to these standards and using these tools, appraisers demonstrate their commitment to ethical practices and protect the integrity of the real estate market.
Breach of Confidentiality

A breach of confidentiality in real estate appraisals can have significant repercussions. When an appraiser fails to protect sensitive information, it can lead to severe legal, financial, and reputational damage. For example, if an appraiser discloses a client’s financial status or property details without consent, it could result in identity theft or financial fraud. Such breaches can undermine client trust and the appraiser’s professional credibility.
Hypothetically, imagine a case where a leaked appraisal report reveals private details about a high-profile client. This could lead to a lawsuit and substantial financial penalties for the appraiser involved. Beyond legal consequences, such breaches could distort the real estate market. Confidential information, if exposed, could unfairly influence property values and disrupt fair market assessments.
Preventing breaches requires stringent adherence to the Uniform Standards of Professional Appraisal Practice (USPAP) and utilizing secure tools and practices. Upholding confidentiality safeguards clients’ interests and maintains the integrity of the real estate industry.
Best Practices for Ensuring Confidentiality

Ensuring confidentiality in real estate appraisals requires adherence to several best practices. Clear and secure communication channels are vital. Appraisers should use encrypted emails and secure file-sharing platforms to transmit sensitive information, minimizing the risk of unauthorized access.
Documentation and data handling are equally important. Appraisers must securely store physical documents and employ secure measures for digital data. For example, using password management tools like LastPass can help in maintaining strong, unique passwords for all accounts.
Professional conduct is also crucial. Continuous education and training on confidentiality standards, such as those outlined by the Uniform Standards of Professional Appraisal Practice (USPAP), ensure appraisers stay informed about the latest privacy protocols. Additionally, appraisers should avoid discussing confidential information in public or unsecured environments.
By implementing these practices, appraisers demonstrate their commitment to protecting client information, fostering trust, and upholding industry standards.
Conclusion
In conclusion, confidentiality in real estate appraisals is paramount for maintaining trust, ethical compliance, and market integrity. Adhering to stringent standards and practices, such as those outlined by the Uniform Standards of Professional Appraisal Practice (USPAP), is essential for protecting sensitive client information. Breaches of confidentiality can lead to severe legal, financial, and reputational consequences, underscoring the importance of secure communication and data handling protocols.
By following best practices—such as using encrypted communication channels provided by major technology providers, implementing secure storage solutions, and engaging in continuous education—appraisers can safeguard client information and maintain the trust and credibility crucial to their profession. Ultimately, upholding confidentiality not only protects clients but also ensures the integrity and fairness of the real estate market, benefiting all parties involved in the transaction. Remember, confidentiality is not just a requirement; it’s a cornerstone of ethical and professional real estate practice.