by Conrad Meertins | Feb 27, 2024 | Market Trends, Valuation

In the realm of real estate, the synergy between homeowners, realtors, and appraisers is not just beneficial; it’s essential.
Drawing from Stephen Covey’s 6th habit, “Synergize”, we see the immense value in collaborative efforts, especially when it comes to the precise task of home valuation. This principle underscores the strength found in teaming up, highlighting how collective inputs lead to superior outcomes.
The Unique Roles in Real Estate Transactions

Realtors are the navigators of the real estate transaction process, masters at brokering deals to ensure fairness and optimal outcomes for their clients. With an in-depth knowledge of market areas honed over years, they are pivotal in guiding homeowners through the complexities of selling or buying a home.

Appraisers, on the other hand, bring a different set of skills to the table. As valuation experts, they delve into the nitty-gritty details of property value, armed with data and trends to pinpoint the most accurate market value.
Their expertise becomes particularly crucial in fluctuating markets, where accurate valuations can make or break a deal.
The Synergy in Action: A Real-World Scenario
Consider a homeowner eager to sell their property. They believe their home is worth $350,000, while their realtor, considering current market dynamics, suggests a starting point of $300,000.
Here, the realtor could either acquiesce to the homeowner’s wishes or provide detailed market insights to align expectations. This is where an appraiser’s expertise becomes invaluable.
Data and Evidence: Understanding Louisville’s Market
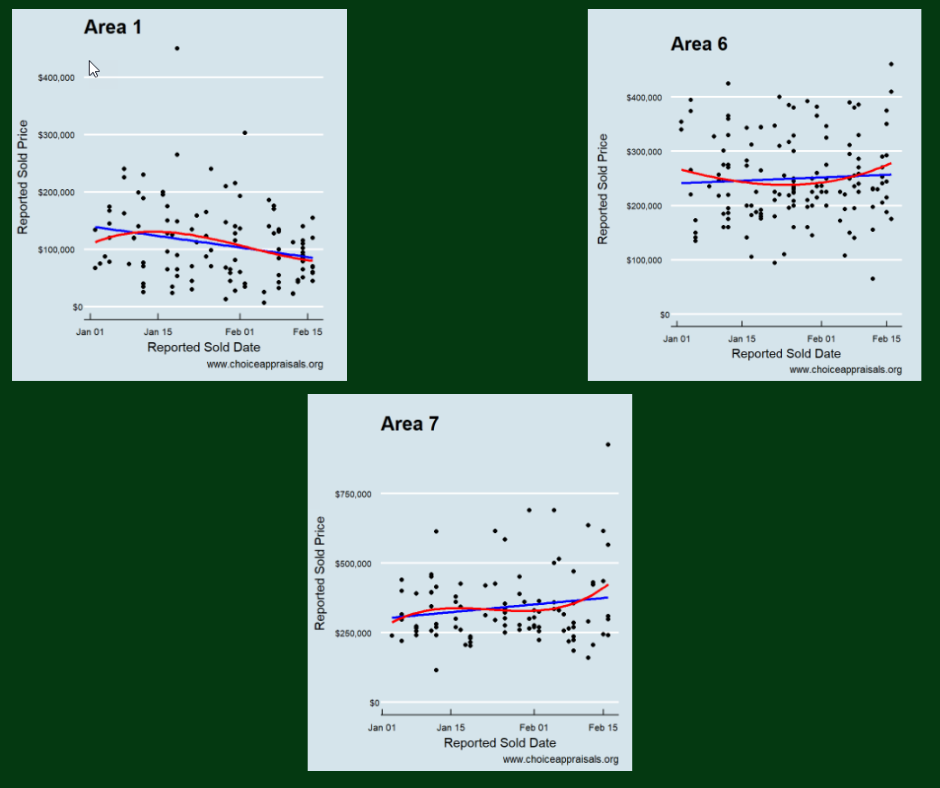
The above graph highlights the trend for homes that sold in MLS Area 1, Area 6, and Area 7. While Area 1 experienced a decline in sales prices with 114 sales, Areas 6 and 7 showed an uptick, boasting 145 and 96 sales, respectively.
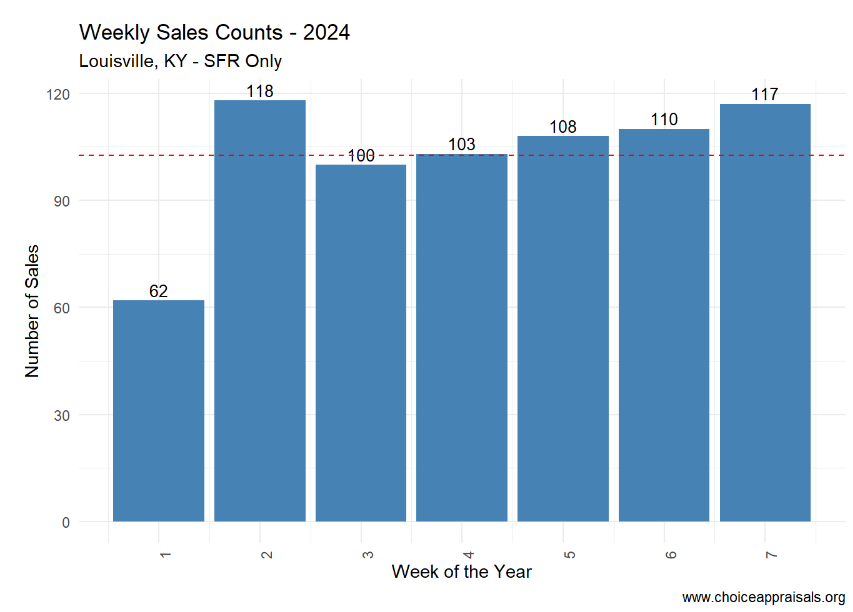
The above graph highlights the weekly volume of sales in Louisville, KY. since week one of 2024

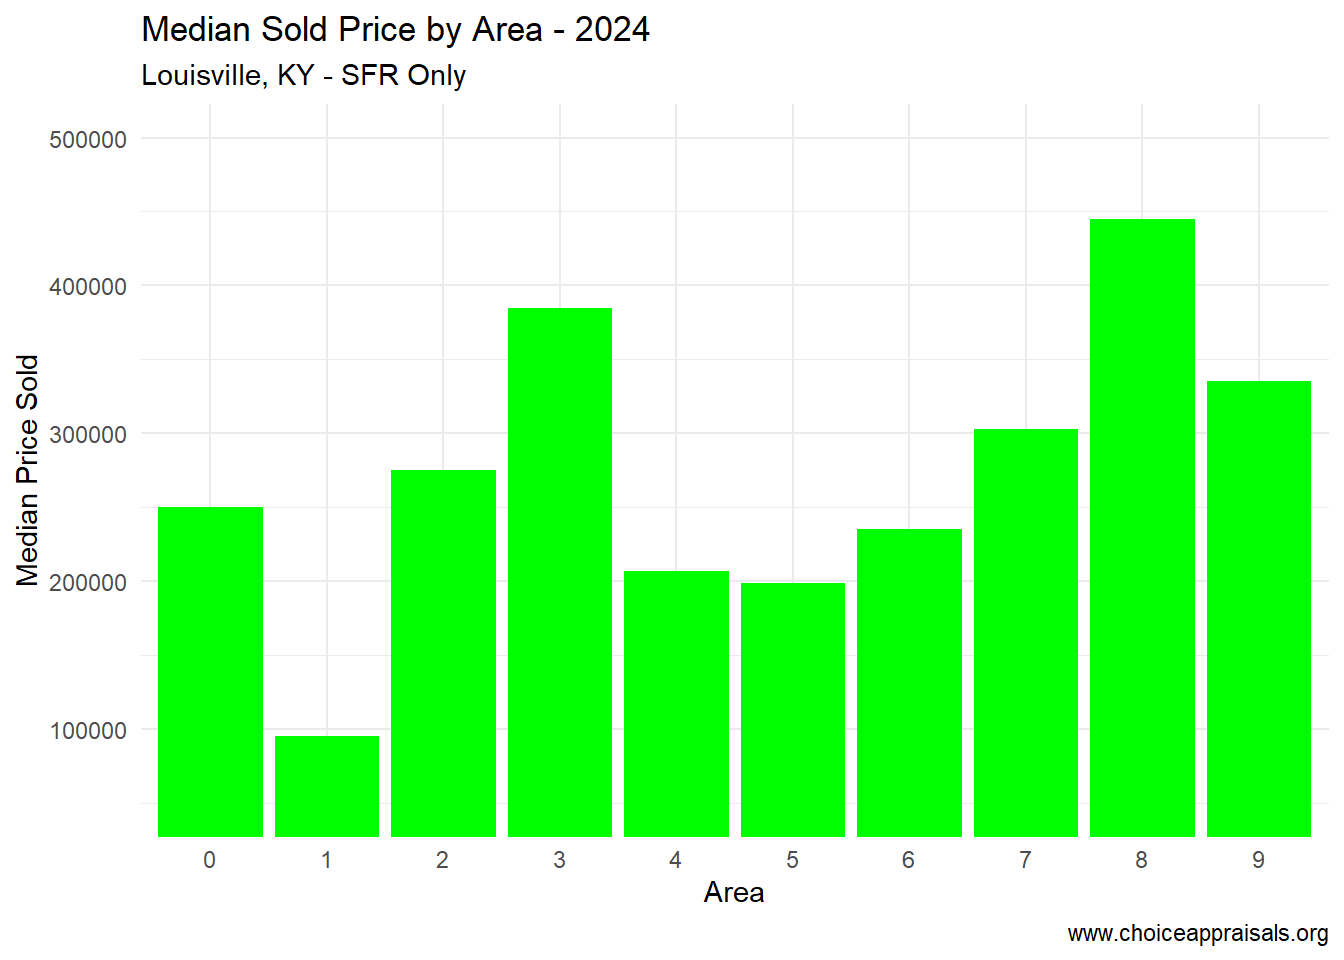
The above graph illustrates the median sale price for each MLS area in Louisville, KY over the first 7 weeks of 2024. As can be seen from the above charts, in week 7 of 2024, Louisville’s real estate market presented varied trends across its MLS areas.
The average days on market hovered between 20 and 25, with an overall median sales price of $249,000 across Louisville.
However, disparities exist, with Area 3 approaching a median of $400K and Area 8 nearing $450K. Such granular data is crucial for appraisers and realtors alike to provide homeowners with accurate, realistic valuations.
Leveraging Synergy for Success

When realtors and appraisers collaborate, sharing insights and data, they ensure homeowners receive the most accurate valuation, tailored to the nuanced dynamics of their specific MLS area.
This synergy not only enhances trust among all parties but also secures a smoother transaction process, grounded in realism and mutual understanding.
Embrace Collaboration

For homeowners, understanding the value of your home is more nuanced than it might appear. Engage both your realtor and a local Louisville appraiser in the conversation.
Realtors, don’t hesitate to bolster your market knowledge with insights from appraisers. Appraisers, your expertise is more critical than ever in today’s data-rich age—collaborate with realtors to demystify market trends for homeowners.
The Winning Formula
Synergy, as Stephen Covey highlighted, is about producing a collective outcome that surpasses what individuals could achieve alone.
In Louisville’s diverse real estate landscape, embracing this collaborative spirit ensures that homeowners, realtors, and appraisers alike can navigate the valuation process with confidence, accuracy, and success.
Let’s work together, leveraging our unique strengths for the common goal of transparent, fair, and effective real estate transactions. Go Louisville, where synergy is indeed where it’s at!
by Conrad Meertins | Jan 8, 2024 | Market Trends

The Power of Proactivity in Real Estate
Have you ever watched a chess master at work? Each move is made not just for the present but for the unfolding game. If she is going to win, one key will be mastering the habit of proactivity.
It’s little wonder that this habit is the first one mentioned of Stephen Covey’s Seven Habits of Highly Effective People. Will Real Estate professionals need this quality for 2024? Absolutely.
As Covey mentioned, exemplifying this habit means that we give ourselves space between stimulus and response and claim our control. In this article I’ll be reviewing activity from the first week of January with the goal of helping you to be proactive in the real estate game.
Current Market Pulse: A Snapshot of Early January 1/1/24 – 1/7/24
Is Our Market Bursting with Options?
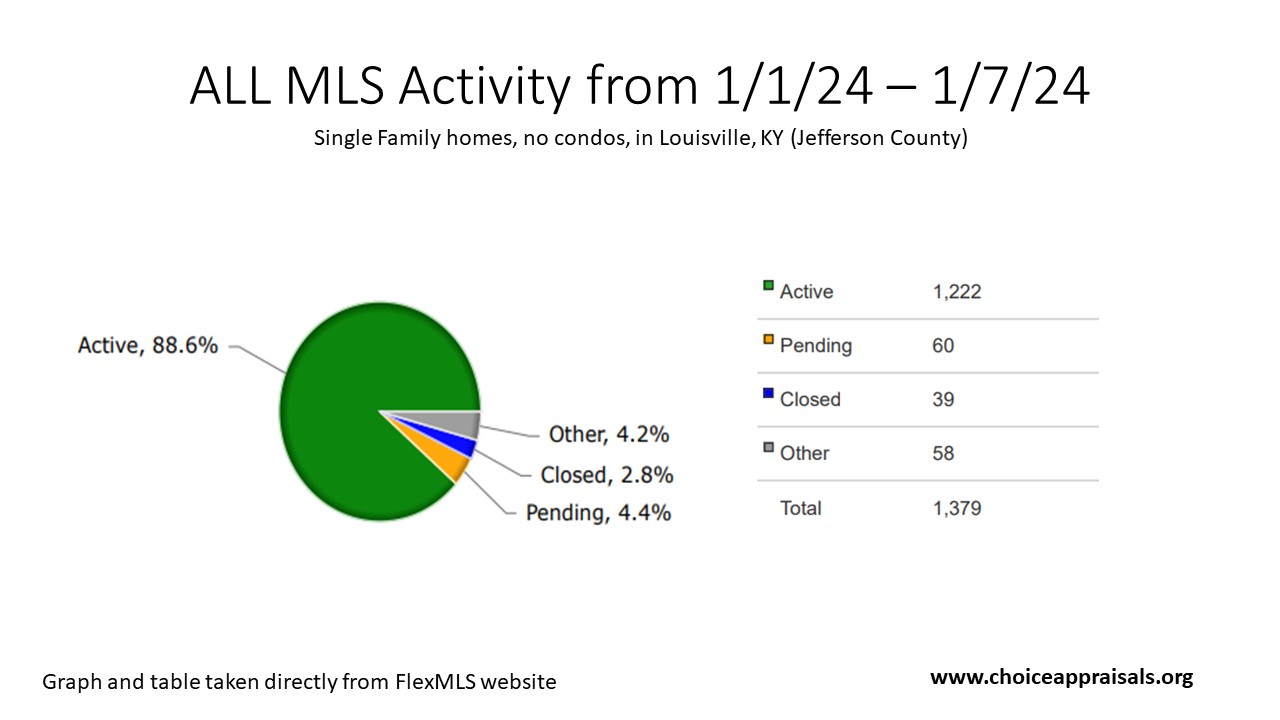
As we stepped into January, we saw 1,222 homes for sale here in Louisville, KY. This could mean lots of choices for buyers. But proactive real estate professionals know there’s a need to look a bit closer.
Only a small slice of homes are actually getting offers (4.4%) and even fewer are being sold (2.8%). Could some homes be priced too high? Or is something else making buyers hesitate?
Something we can’t get away from is the fact that interest rates are between 6.62% and 7.20% for most home loans (depending on where you shop). Even though these rates have dipped a tiny bit, they’re still pretty high compared to the past, which could make buyers slow down and think twice as they contemplate that higher monthly payment.
Plus, let’s be real, moving when it’s cold and right after spending time off with family isn’t a fun idea for many people. That can definitely make for a slower market.
So what’s the real deal in Louisville, with our market (1222 active listings) in this chilly season?
We might have:
- a vibrant market with lots of options for buyers.
- a market that’s taking a breather with homes not selling as fast as expected. Or
- overpriced listings.
To really understand what’s happening, we’re going to take a closer look at the homes that did sell during the first seven days of January 2024 and check out the Cumulative Days on Market of homes that are still active.
What Week 1 -January 2024 Sales Reveal
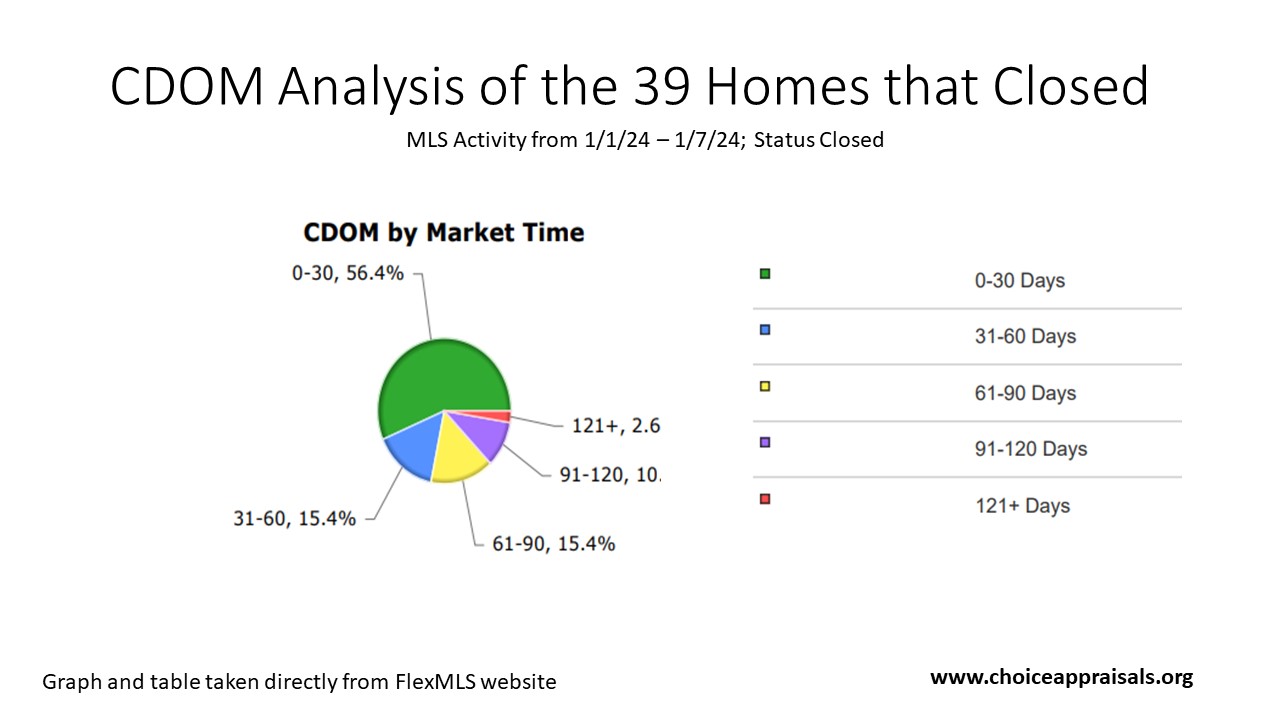
Peering into the recent sales gives us a clearer picture of our winter market. In January’s first week, out of 1,222 homes up for grabs, 39 made it across the finish line. But how fast?
The pie chart lays it out: Over half of the homes sold (56.4%) in 30 days or less. This brisk movement indicates a segment of our market is priced just right—homes that buyers are snatching up quickly, likely because they hit that sweet spot of value and appeal.
Then there’s the 15.4% that closed in 31-60 days and another 15.4% in 61-90 days.
These homes took their time, but not too much time. It suggests a balanced approach—perhaps a minor price negotiation here or a little patience there paid off.
The smaller slices—10% selling in 91-120 days and a sliver at 2.6% beyond 120 days—tell us some stories took longer to tell.
These could be homes where initial expectations needed adjusting, whether due to price, property quirks, or just finding the right buyer who sees a diamond where others didn’t.
While this data strengthens our understanding of the Louisville market timings, a deeper layer awaits our attention – the interplay between the final Sale Price and the Original List Price (SP/OLP). This ratio sheds light about the art of pricing accurately from the onset.
January Sales with a focus on Sold Price/List Price Ratios
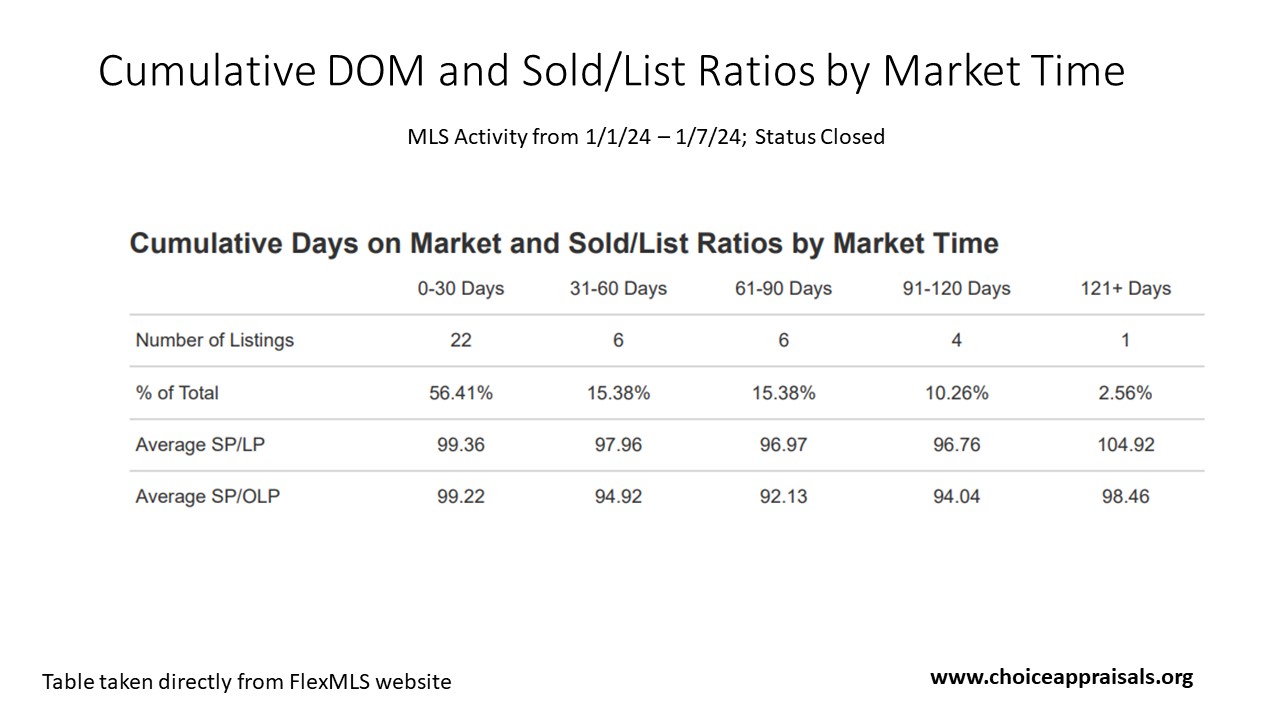
The Average Sold Price to Original List Price (SP/OLP) ratio tells us how the final sale price compares to the initial asking price.
0-30 Days: Homes in Louisville, KY that sold within a month almost met their asking price, with an SP/OLP of 99.22%, indicating they were likely priced right from the start.
31-60 Days: The drop to an SP/OLP of 94.92% for homes sold in one to two months hints at negotiations, perhaps due to ambitious initial pricing.
61-90 Days: A further dip in SP/OLP to 92.13% for sales in two to three months suggests either significant price drops or shifts in market trends.
Armed with stats like these you can advise clients on pricing their homes to sell within a desired timeframe, considering market dynamics.
But what about homes that are still on the market? How long have they been sitting, and what does their waiting time tell us?
To answer that question, let’s pivot to a Cumulative DOM analysis for active listings. In doing so, we’ll uncover another layer of the market’s story.
Average and Median Days on Market – for Homes that Have Not Sold
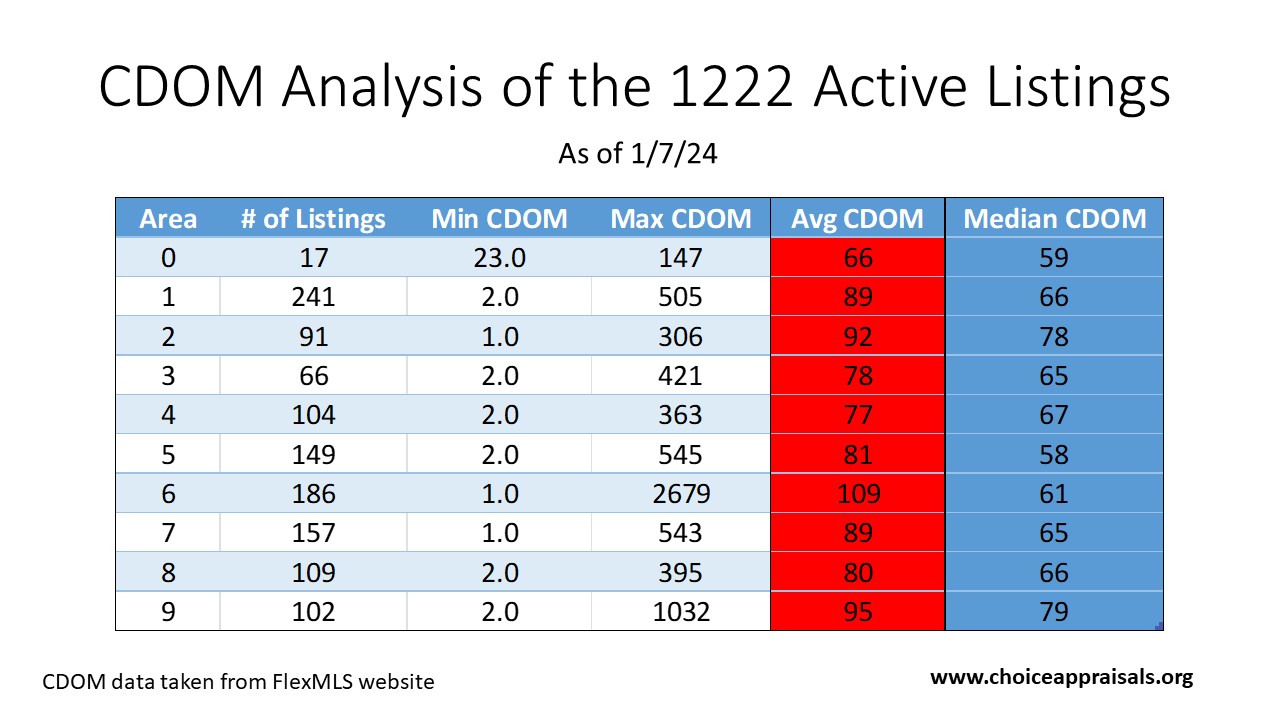
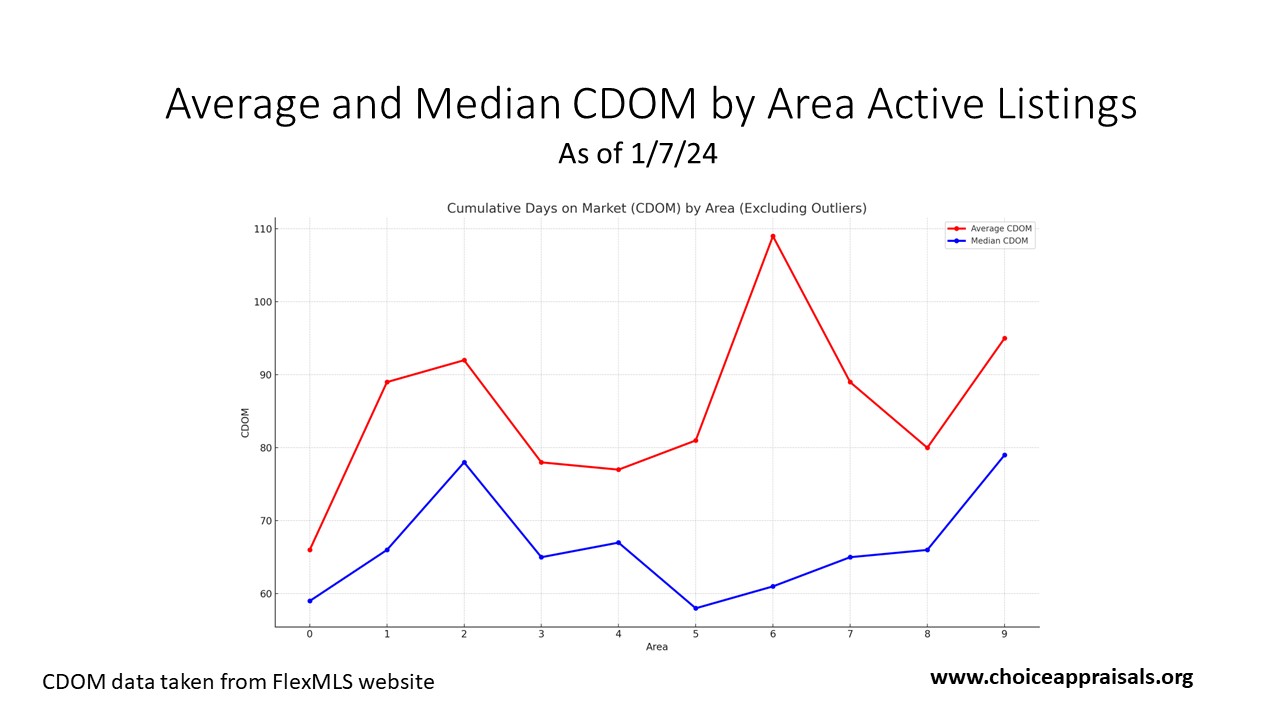
The canvas of our January market, with 1,222 active listings, is rich with detail when viewed through the lens of CDOM. The average CDOM across all MLS Areas is currently between 66 and 109 days.
The median CDOM, which ranges from 58 to 79 days across the areas, is a more balanced lens since the median is less affected by outliers. It indicates that over half of the homes have been listed for about two months or less. This is a more typical timeframe in a balanced market.
These insights are crucial for managing expectations on both ends—sellers can gauge how long it might take to sell their home, and buyers can spot opportunities for negotiating better prices on listings that have been on the market longer.
As we wrap up our review of January’s first week, remember that these statistics do more than just inform—they enable you to lead in the marketplace with authority and foresight.
But in order for that to happen you have to continue to pause after your exposure to data like this. Think about how it relates to a current or upcoming listing, and then take the appropriate response that indicates purposeful control – That’s being proactive!
Next week, we’ll delve into the second of Covey’s habits, ‘Begin with the End in Mind’, to further refine our strategic approach to real estate success.
Have a great week.
Conrad Meertins Jr.