by Conrad Meertins | Nov 3, 2025 | Uncategorized

You priced the listing based on solid comps. It showed well. You got an accepted offer. Then the appraisal came back short—and suddenly you’re managing a renegotiation, an angry seller, or a dead deal.
Sound familiar?
Here’s what most agents miss: your CMA and the appraiser’s analysis are based on different tools and standards. You’re both analyzing the market — but the appraiser’s opinion of value is based primarily on closed sales and adjustments supported by market data.
The gap between those two perspectives is where deals fall apart. After reviewing thousands of appraisals, I’ve identified the five blind spots that create that gap most often—and how to anticipate them before your next listing goes live.
Table of Contents
- Think Like an Appraiser: The Game Plan
- Blind Spot #1: Ignoring Functional Obsolescence
- Blind Spot #2: Overvaluing Cosmetic Upgrades
- Blind Spot #3: Misreading Market Movement
- Blind Spot #4: Ignoring Micro-Location Premiums
- Blind Spot #5: Not Partnering Early with an Appraiser
The Game Plan: Think Like an Appraiser

Appraisers don’t define “comparable” the way agents do. And that gap is where most pricing mistakes happen.
Here’s what agents often miss: appraisers weight factors based on what the market proves matters—not what agents assume matters. In some markets, square footage drives value. In others, views or condition dominate. The key: it’s always data-driven, never formulaic.
Most CMAs rely on recent sales and general proximity. Appraisers dig deeper—analyzing paired sales to quantify specific differences, reviewing buyer behavior patterns, and testing adjustments against actual market reactions.
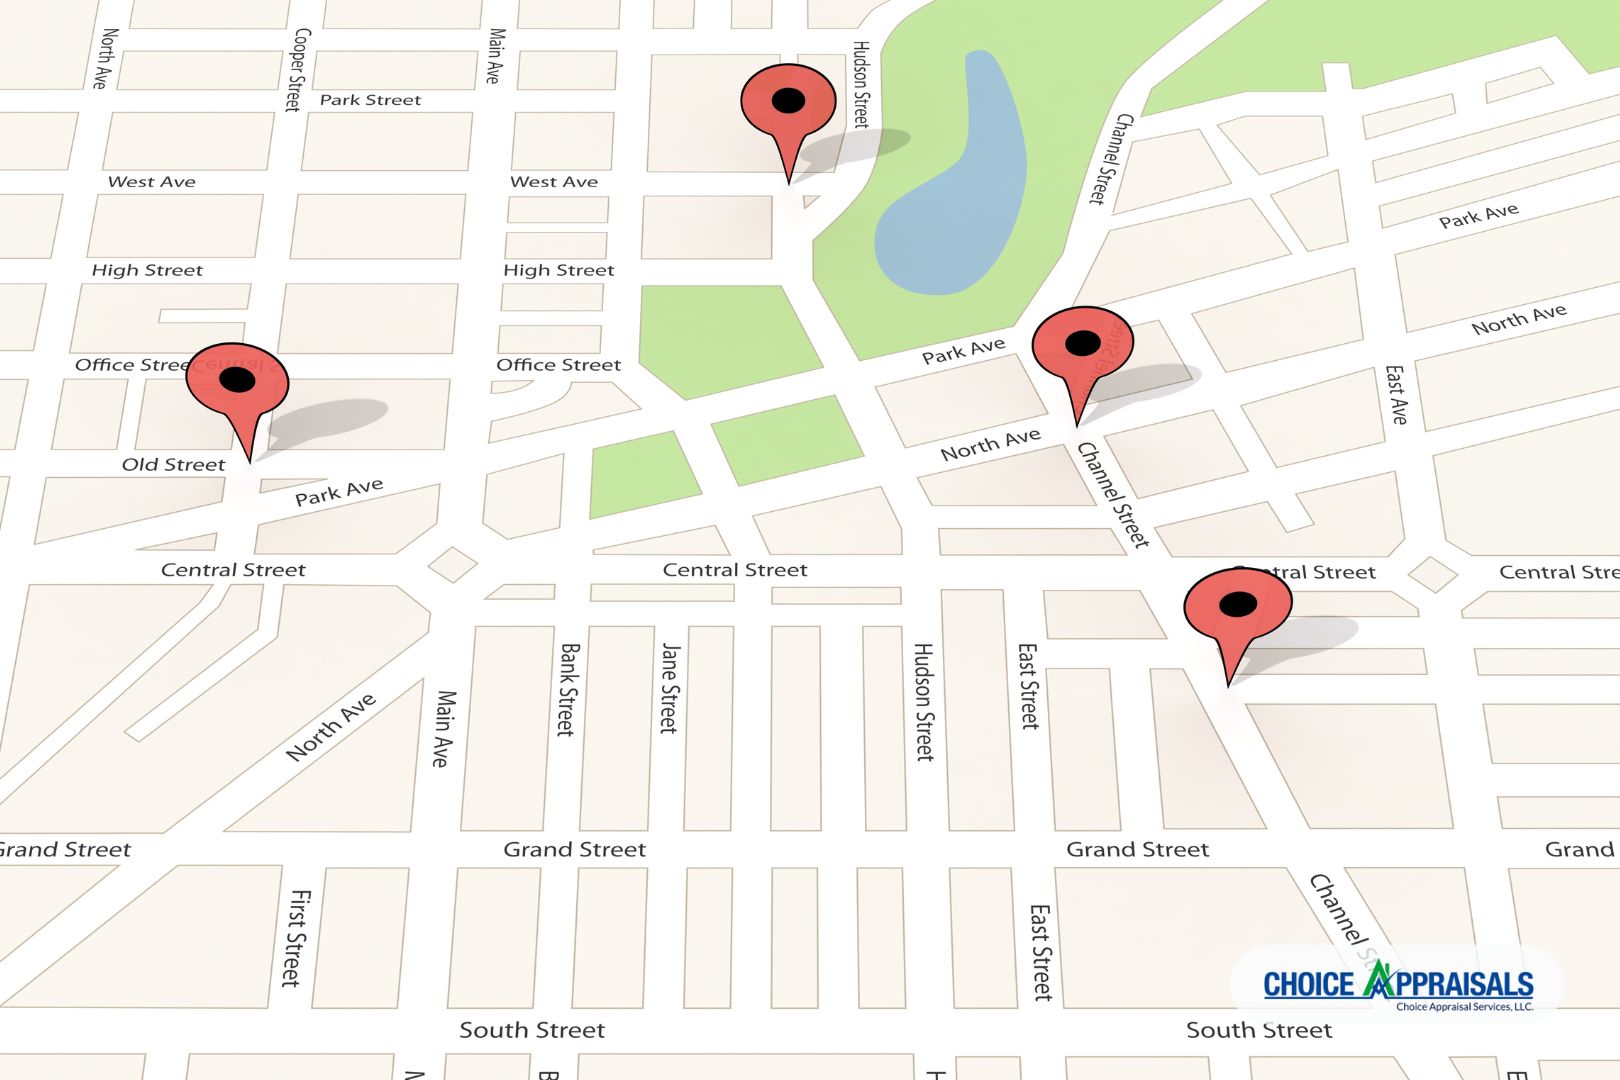
Example: An agent might use a same-size home 0.5 miles away because it closed at a great price. An appraiser might reject it because it’s across a busy road or in a different school district—and comparable sales data proves buyers pay differently for those location factors.
The result? Your comp supports your price. The appraiser’s comp doesn’t. And your deal is now $40K underwater. Of course, that’s an over-simplification, but you get the idea.
A note on price per square foot: It’s not a value conclusion—it’s a supporting data point. Appraisers use it to test adjustments and spot trends, but never as a standalone indicator of value. A 1,200 sf home at $400/sf isn’t automatically worth more than a 2,400 sf home at $350/sf. Quality, location, and market-specific features determine value—the math just helps verify consistency.
Bottom line: If you’re not thinking about how the market actually reacts to specific property differences, you’re building your CMA on assumptions the appraiser can’t support.
Blind Spot #1: Ignoring Functional Obsolescence
Functional obsolescence is the valuation term for layouts that don’t work for today’s buyers. It’s not about ugly—it’s about inefficiency that the market penalizes.
Real example: A beautifully remodeled 1960s ranch with brand-new finishes appraised $25K lower than expected. Why? The layout featured four small shotgun bedrooms—each accessible only by walking through another—with no true primary suite and a kitchen cut off from the main living areas.
Despite the high-end materials, buyers consistently paid less for that kind of choppy, outdated layout. The closed sales made it clear: Gorgeous materials couldn’t fix a floor plan that comparable sales proved buyers avoided or paid less for.
Here’s the critical part: appraisers adjust for functional obsolescence when market data proves buyers paid less for inefficient layouts—not based on personal preference or design trends. If comparable sales show a measurable difference in price for similar square footage with better flow, the adjustment is supportable. If not, there’s no adjustment.
Walk the home like an appraiser, not a stager. Ask:
- Does the flow match how buyers live today?
- Is the primary suite competitive with other homes in this price range?
- Are there shotgun bedrooms?
- Do comparable sales show a price difference for these layout issues?
If the answer to that last question is yes, price accordingly. Buyers might fall in love anyway—but the appraiser won’t overlook what the market data reveals.
Blind Spot #2: Overvaluing Cosmetic Upgrades

Here’s the nuanced truth about upgrades: not all improvements add the same value, and market reaction varies by what buyers expect vs. what they reward.
Appraisers distinguish between updates that meet baseline expectations and those that create competitive advantages. A new roof or working HVAC system? Buyers expect those to function—they’re not paying premiums for them. But a thoughtfully updated kitchen with new countertops and backsplash? That can actually shift a home’s condition rating and create measurable market preference.
What often adds measurable value (when done well):
- Kitchen and bath updates that modernize dated spaces (countertops, backsplash, fixtures—especially when they transform the overall impression)
- Square footage additions (permitted)
- View premiums (when comparable sales support them)
- ADUs or income-generating features
- Finished basements or bonus spaces (in markets where this matters)
What typically doesn’t add much (buyers just expect it to work):
- New roof (prevents a deduction, rarely adds premium)
- HVAC replacement (maintenance, not value-add)
- Foundation repairs (fixes a problem, doesn’t create advantage)
- Energy efficiency upgrades (solar, high-efficiency systems—market reaction is inconsistent and often doesn’t match cost)
“A new roof doesn’t add $15K in value—it helps avoid a $15K hit from buyers discounting for deferred maintenance. But a refreshed kitchen can actually improve the home’s marketability and shift its competitive position.”
Here’s why kitchen updates can matter more than you’d think: When countertops and backsplash are part of a coordinated update (maybe paired with paint, hardware, and lighting), they can elevate a home from C4 (Average) to C3 (Average/Good) condition in the appraiser’s analysis. That condition rating shift affects which comparable sales are most relevant—and can support a higher value range.
If your seller just spent $50K on a new roof and HVAC, manage expectations: those updates make the home financeable and marketable, but they’re bringing it to baseline—not past it. If they spent $20K smartly updating the kitchen? That has a better chance of moving the value needle, because it changes how buyers (and appraisers) perceive the home’s competitive position.
The key: Appraisers adjust based on market reaction and condition assessment—not renovation cost or Instagram appeal.
Blind Spot #3: Misreading Market Movement
You’re analyzing current market momentum. Appraisers are verifying it with closed data.
When the market’s moving fast, this creates tension. You’re seeing pending offers at $650K. The appraiser is prioritizing closed sales from recent months at $610K. That $40K gap isn’t imaginary—but it needs to be supported with data, not just asserted based on current listings.
Here’s what many agents don’t realize: Appraisers can and do use pending sales and active listings to support market direction—especially in fast-moving markets. The difference is in how they’re analyzed. Pending sales need verification. Active listings show market expectations, not concluded transactions. Both can support time adjustments or market trend analysis when properly documented.
Here’s how to bridge the gap:
- Provide pending sales data with detail (if you have access to accepted offer prices and can verify terms)
- Include active listings to demonstrate where the market is heading (appraisers can use this to support directional trends)
- Supply market trend data (days on market, absorption rates, price movements by neighborhood or property type)
The key: don’t just show the appraiser what sold. Show them why the market shifted and provide data that supports the trend.
If you’re pricing in a rising market, document everything. Give the appraiser the market story backed by verifiable data—not just current enthusiasm.
And here’s the bottom line: however strong the market momentum, the appraised value still needs to be supported by at least one recent, closed sale that doesn’t require upward adjustment to reach the contract price. Pending and active listings can support a trend—but they can’t carry the value on their own.
Blind Spot #4: Ignoring Micro-Location Premiums

Two identical homes. Same square footage, same finishes, same school district. One backs open space. One backs a retail center parking lot.
The difference? $15,000.
Appraisers analyze micro-location factors that many agents treat as “intangibles”:
- View (mountains, water, open space vs. rooftops or parking lots)
- Orientation (southern exposure vs. northern)
- Traffic patterns (quiet cul-de-sac vs. busy collector road)
- Adjacent land use (greenbelt vs. power lines, parks vs. commercial)
These factors aren’t ignored—they’re adjusted for when market data supports them. An appraiser won’t add $50K for a view just because it’s desirable. They’ll add it because paired sales analysis or comparable sales prove buyers consistently paid a premium for it.
This is why comparable selection matters so much. If your comparable home backs open space and the subject backs a parking lot, that’s not an equal comparison—and appraisers will adjust for the difference if market data quantifies it.
The move: If your listing has a location advantage, identify comparable sales that prove the premium. If it has a disadvantage, find comparables that reflect the penalty and price accordingly. Don’t assume buyers will pay a premium the market data doesn’t support.
Blind Spot #5: Not Partnering Early with an Appraiser

Most agents call an appraiser after the deal is in trouble. Smart agents consult before the listing goes live.
A pre-listing valuation consultation gives you:
- Insight into potential valuation challenges before you commit to a price
- A clearer understanding of which upgrades or features the market actually rewards
- Protection against deal fallout later (you’ve already stress-tested the price against appraisal standards)
Important distinction: This isn’t a formal appraisal—it’s a consulting conversation. No value opinion is provided without a proper appraisal engagement. But the perspective can help you identify red flags early: functional issues the market penalizes, cosmetic upgrades that won’t move the needle, or comparable sales you might have missed.
Think of it as pricing insurance. You’re not guessing what the appraiser will conclude—you’re thinking through the valuation lens before you go live.
Here’s the move: Before your next listing appointment, walk the property with an appraiser’s perspective. Identify the functional issues, the upgrades that matter vs. those that don’t, the micro-location factors that create premiums or penalties. Then price based on what market data will support—not just what current buyer excitement suggests.
And if you’re not sure? Consult with an appraiser before you commit to a number.
Schedule a Pre-Listing Valuation Consultation →
(This is a consulting service—not a formal appraisal. It’s designed to help you identify potential valuation challenges before your listing goes live.)
The Bottom Line
Appraisers don’t kill deals. Unsupportable pricing does.
When you price with the valuation lens—understanding how appraisers analyze comparables, weight market data, and test assumptions—you’re not guessing. You’re building a price that can survive scrutiny.
The agents who master this? They’re the ones sellers trust, buyers respect, and other agents refer to. Because when the appraisal comes back, their deals close.
Next time you price a listing, ask yourself:
Can I support this number with market data an appraiser would find credible?
If you can’t back it up with data an appraiser would find credible, think twice before committing to the price.
by Conrad Meertins | Jan 20, 2025 | Valuation

My first experience with an ADU was about a decade ago in Old Louisville. It was a four-story single-family residence (a beautiful brownstone). Just as I thought I had finished the appraisal, the owner asked, “Would you like to see the carriage house?”
I didn’t know there was more to see, but I confidently said, “Of course!” I was looking forward to it, not realizing at the time how ADUs would eventually become a significant trend in real estate.
As a Louisville appraiser, I’ve witnessed firsthand how Accessory Dwelling Units (ADUs) are reshaping our local real estate market. From the historic carriage houses in Old Louisville to newly constructed garden suites in St. Matthews, these versatile spaces are becoming increasingly valuable additions to Kentucky properties.
Let’s explore how ADUs impact market value, both positively and negatively, and what homeowners and buyers need to know about Fannie Mae’s guidelines.
The Upside: Positive Impacts of ADUs on Market Value

1. Increased Property Value in Our Market
Here in Louisville, where housing demand continues to grow, particularly in areas like the Highlands and Crescent Hill, ADUs often significantly increase a property’s value. The charm of our historic neighborhoods makes these additions especially appealing when they complement the architectural character of the main residence.
2. Rental Income Potential in Derby City
With the Kentucky Derby, Louisville’s growing tourism industry, and our expanding medical district, ADUs offer unique rental opportunities. From short-term rentals during major events to long-term leases for medical residents and students, ADUs can provide substantial income streams that help offset mortgage costs or generate additional cash flow.
3. Enhanced Market Appeal in Our Community
Louisville’s multi-generational families and young professionals are increasingly seeking properties with ADUs. Whether it’s housing aging parents in Cherokee Gardens or creating a home office in Clifton, these spaces offer the flexibility and versatility that our local market demands.
4. Flexibility in Use
ADUs can adapt to the changing needs of homeowners. Today, they might serve as a rental unit or guest house; tomorrow, they could be a home office, a space for aging relatives, or even a short-term rental during Derby week.
Challenges to Consider: The Downsides of ADUs

While ADUs offer incredible benefits, there are challenges to keep in mind:
1. High Construction Costs
Building an ADU can be a significant upfront investment, ranging from $100,000 to over $400,000 depending on size, design, and location.
2. Zoning and Regulatory Hurdles
Local zoning laws and permitting requirements can be complicated. Noncompliant or illegal ADUs may impact insurance claims, property marketability, or financing options.
3. Increased Property Taxes
Adding an ADU typically increases a property’s assessed value, which means higher property taxes.
4. Maintenance and Management
For those renting out their ADU, property management and maintenance become ongoing responsibilities.
5. Type of ADU Impacts Value Differently
- Detached ADUs generally add the most value.
- Attached ADUs come next.
- Internal ADUs (like basement apartments) add the least value but can still be significant depending on the market.
What Does Fannie Mae Say About ADUs?

As a key player in the mortgage market, Fannie Mae provides specific guidelines for properties with ADUs:
- Appraisal Requirements: Appraisers must evaluate how the ADU contributes to market value by analyzing comparable sales or, if none are available, using a cost-based approach.
- Gross Living Area (GLA): ADUs are appraised separately from the main dwelling unless they are within it and have interior access.
- Legal Compliance: ADUs must meet local zoning laws and regulations to be included in the property’s valuation.
- Financing and Underwriting: Lenders must follow specific loan-to-value (LTV) and debt-to-income (DTI) guidelines while factoring in potential rental income from the ADU.
Real-Life Insights: ADUs in Louisville

My most recent experience with an ADU involved a proposed construction project—a $1.3 million build featuring a 3,500-square-foot main residence with an attached garage and a 1,500-square-foot ADU on the other side of the garage.
The design was not only stunning but also supported by the local market, demonstrating a positive correlation between construction costs and property value in this case.
Looking Forward: What ADUs Mean for Louisville

As Louisville continues to grow and evolve, ADUs represent a significant opportunity for property owners. Whether you’re in the Highlands, Butchertown, or the expanding East End, understanding how these units impact property values is crucial for making informed real estate decisions.
Adding an ADU can increase property value, generate income, and provide flexibility, but it also requires careful planning, compliance with local regulations, and a clear understanding of market trends.
Fannie Mae’s guidelines play a vital role in shaping how ADUs are appraised and financed, so it’s important to factor these into your decision-making process.
If you’re considering adding an ADU to your property—or buying a home with one—consulting with a professional appraiser who understands the local market can make all the difference.
Need professional guidance on ADU appraisal in Louisville? Contact me for a thorough valuation of your property’s potential!
by Conrad Meertins | Jan 13, 2025 | Uncategorized

In the world of real estate, few topics generate more discussion and debate than property appraisals. As a crucial component of nearly every real estate transaction, understanding how appraisers actually use comparables (or “comps”) can make the difference between a smooth closing and a deal-breaking surprise. Let’s pull back the curtain on this often misunderstood process.
Beyond the “Closest House” Myth
One of the most persistent myths in real estate is that the house down the street is automatically the best comparable. While proximity matters, it’s just one piece of a complex puzzle. Professional appraisers consider numerous factors when selecting comparables:
Market timing is crucial – a sale from six months ago might be less relevant than a similar property that sold last month in a neighboring community, especially in rapidly changing markets. The goal is to capture the most accurate snapshot of current market conditions, not simply find the closest properties.
Consider this: A colonial-style home with premium finishes might have more in common with a similar property half a mile away than with the ranch-style house next door, even if they share the same square footage. Professional appraisers understand these nuances and select comparables that truly reflect the subject property’s characteristics.
The Science Behind Adjustments

Contrary to popular belief, appraisal adjustments aren’t arbitrary numbers pulled from thin air. They’re based on detailed market analysis and documented evidence. Here’s how it really works:
Appraisers use paired sales analysis to isolate the value of specific features. By comparing similar homes where one has a particular feature (like a finished basement) and one doesn’t, they can determine the market’s actual response to that feature. This method provides concrete evidence for adjustments rather than relying on construction costs or personal opinion.
Let’s look at some real market data from our downtown area that demonstrates how adjustments are determined:
Real Market Data: Bedroom Count Impact
Recent market analysis reveals clear value differences based on bedroom count and their corresponding median sales price (keep in mind this data for one specific market area as of this month:
- 2 bedrooms: $116,500
- 3 bedrooms: $151,000
- 4 bedrooms: $169,000
This data tells us that the market values the difference between a 2-bedroom and 3-bedroom home at approximately $34,500, while the jump from 3 to 4 bedrooms adds about $18,000 in value. When appraisers make bedroom count adjustments, they use this type of market-derived data rather than arbitrary figures.
Real Market Data: Basement Configuration
The market also shows clear preferences for different basement types:
- No basement: $115,000
- Interior access only: $146,300
- Outside entry: $160,000
This data indicates that adding a basement with outside entry adds about $45,000 to a home’s value compared to no basement, while an interior-access-only basement adds approximately $31,300. These are the kinds of concrete market differences that inform adjustment decisions.
Why Your Renovation Might Not “Add Up”

One of the most challenging conversations in real estate is explaining why a $50,000 kitchen renovation might not result in a $50,000 increase in appraised value. The reason lies in how markets actually respond to improvements:
Markets often recognize value differently than construction costs. While a high-end kitchen renovation might cost $50,000, if similar homes in the area typically sell for only $25,000 more with updated kitchens, that’s what the market is willing to pay. Appraisers must reflect this market reality in their adjustments, regardless of actual improvement costs.
The Role of Market Conditions

Time adjustments are perhaps the most misunderstood aspect of the appraisal process. In rapidly changing markets, even sales from three months ago might need significant adjustments to reflect current conditions. These adjustments are based on documented market trends, not guesswork.
For example, if market analysis shows home values in an area have appreciated by 1% per month, a comparable sale from four months ago would need a 4% upward adjustment to reflect current market conditions. This systematic approach ensures that older sales remain relevant while accounting for market changes.
Professional Judgment in Context

While appraisal adjustments are data-driven, professional judgment still plays a vital role. The key is understanding where and how this judgment is applied:
Appraisers must weigh competing factors, such as whether to use an older sale that’s very similar to the subject property or a more recent sale that requires larger adjustments. These decisions are guided by professional standards and market evidence, not personal preference.
Working Together for Better Outcomes

For real estate professionals and homeowners alike, understanding the appraisal adjustment process leads to better outcomes. Here’s how you can help:
- Maintain detailed records of improvements, including dates and costs
- Document any unique features or recent updates that might not be visible during inspection
- Provide information about recent changes in the neighborhood that might affect value
- Be prepared to share information about any previous offers or market exposure
The Bottom Line
The appraisal adjustment process is far more rigorous and market-based than many realize. While it may sometimes deliver unexpected results, understanding how comparables are really used can help all parties navigate the process more effectively.
Remember: The goal of an appraisal is not to hit a predetermined number but to provide an objective opinion of value based on market evidence. When all parties understand this fundamental truth, we can work together more effectively to facilitate successful real estate transactions.
by Conrad Meertins | Jan 6, 2025 | Uncategorized

Is spring really the best time for a home appraisal, or is it just a myth? While many assume that spring and summer are ideal seasons due to curb appeal and heightened real estate activity, the reality is far more nuanced. This post will help separate fact from fiction, offering practical insights into the optimal timing for an appraisal.
Seasonal Impact on Appraisals

Increased Sales Data
Spring and summer often see a higher volume of real estate transactions, providing appraisers with more recent and relevant comparable sales data. This increased data can lead to more robust market analyses, but it doesn’t guarantee higher property values.
Market Activity Levels
Heightened buyer demand during spring and summer can drive up sales prices, reflecting a more competitive market. However, more activity also means more properties, including lower-value ones, which may temper average price gains.
Supply and Demand Shifts
While buyer demand can push prices higher, an influx of listings can balance or even suppress those gains. Think of it as a balancing act: a hot market doesn’t always translate to higher valuations if supply meets or exceeds demand.
Timelines and Appraisal Volume
Peak seasons mean busier appraisers, which can lead to longer turnaround times. If you’re on a tight schedule, consider booking your appraisal early to avoid delays.
Seasonal Appeal
Spring and summer may show your property at its best—lush landscaping, bright interiors, and improved curb appeal can positively influence a buyer’s impression. However, appraisers rely on market data and property condition over aesthetics, ensuring a balanced valuation.
Why Waiting Might Not Guarantee a Higher Appraisal

Market Dynamics Can Vary
Property values depend on current market trends, not just the season. For instance, rising interest rates in summer might offset increased demand, stabilizing or even lowering home prices.
Comparable Sales Adjustments
Appraisers adjust for market timing. If comparable sales from a busy season reflect higher prices, these will be factored into the appraisal even if your property is assessed in an off-season.
Seasonal Competition
A busy market can lead to more listings, creating competition that tempers price increases. Conversely, reduced competition in slower months might work in your favor.
Current Market Trends
Local markets are highly variable. Broader seasonal patterns might not align with trends in your area, making it essential to focus on regional conditions rather than national expectations.
The Importance of Current Market Conditions

Timely and Reliable Appraisals
Appraisals reflect a property’s value at the time they’re conducted, offering a snapshot based on market conditions. Waiting for a specific season can delay your plans and may not result in higher valuations.
Actionable Insights
Scheduling an appraisal now ensures you have the most current data, helping you make informed decisions, whether for a sale, refinancing, or tax appeal.
Professional Objectivity
Appraisers are trained to account for market variables and timing, ensuring an unbiased and accurate valuation regardless of the season.
The Bottom Line
While spring and summer may offer more comparable sales data and aesthetic appeal, they don’t guarantee higher appraised values. Factors like market demand, supply, and broader economic conditions have a greater impact on property value.
Here’s the key takeaway: the best time for a home appraisal is when you need it. Whether it’s summer or winter, a well-maintained property will reflect its true market value, thanks to the expertise of a professional appraiser.
Thinking about getting a home appraisal? Give me a call today to gain a clear understanding of your property’s value in the current market. Don’t wait for the “perfect” season—schedule your appraisal when it aligns with your goals.
by Conrad Meertins | Dec 30, 2024 | Valuation

So, you’re a real estate professional, right? You’re no stranger to appraisal reports. They’re part of your daily grind. But let’s be real, these documents can sometimes feel like they’re written in a different language. How can you crack the code to understanding them better? That’s what this article is all about.
An appraisal report, in its simplest form, is an unbiased estimate of the value of a property. It’s an essential tool for lenders, buyers, and yes, agents like you. Why? Because it provides a defensible opinion of market value of a property, which is crucial in any real estate transaction.
Understanding appraisal reports isn’t just a nice-to-have skill. It’s a must. When you know your way around these reports, you’re in a better position to advise your clients, negotiate deals, and close sales. It’s about leveling up your game in the competitive world of real estate. So, are you ready to dive in? Let’s do this.
Tip 1: Know the Basics
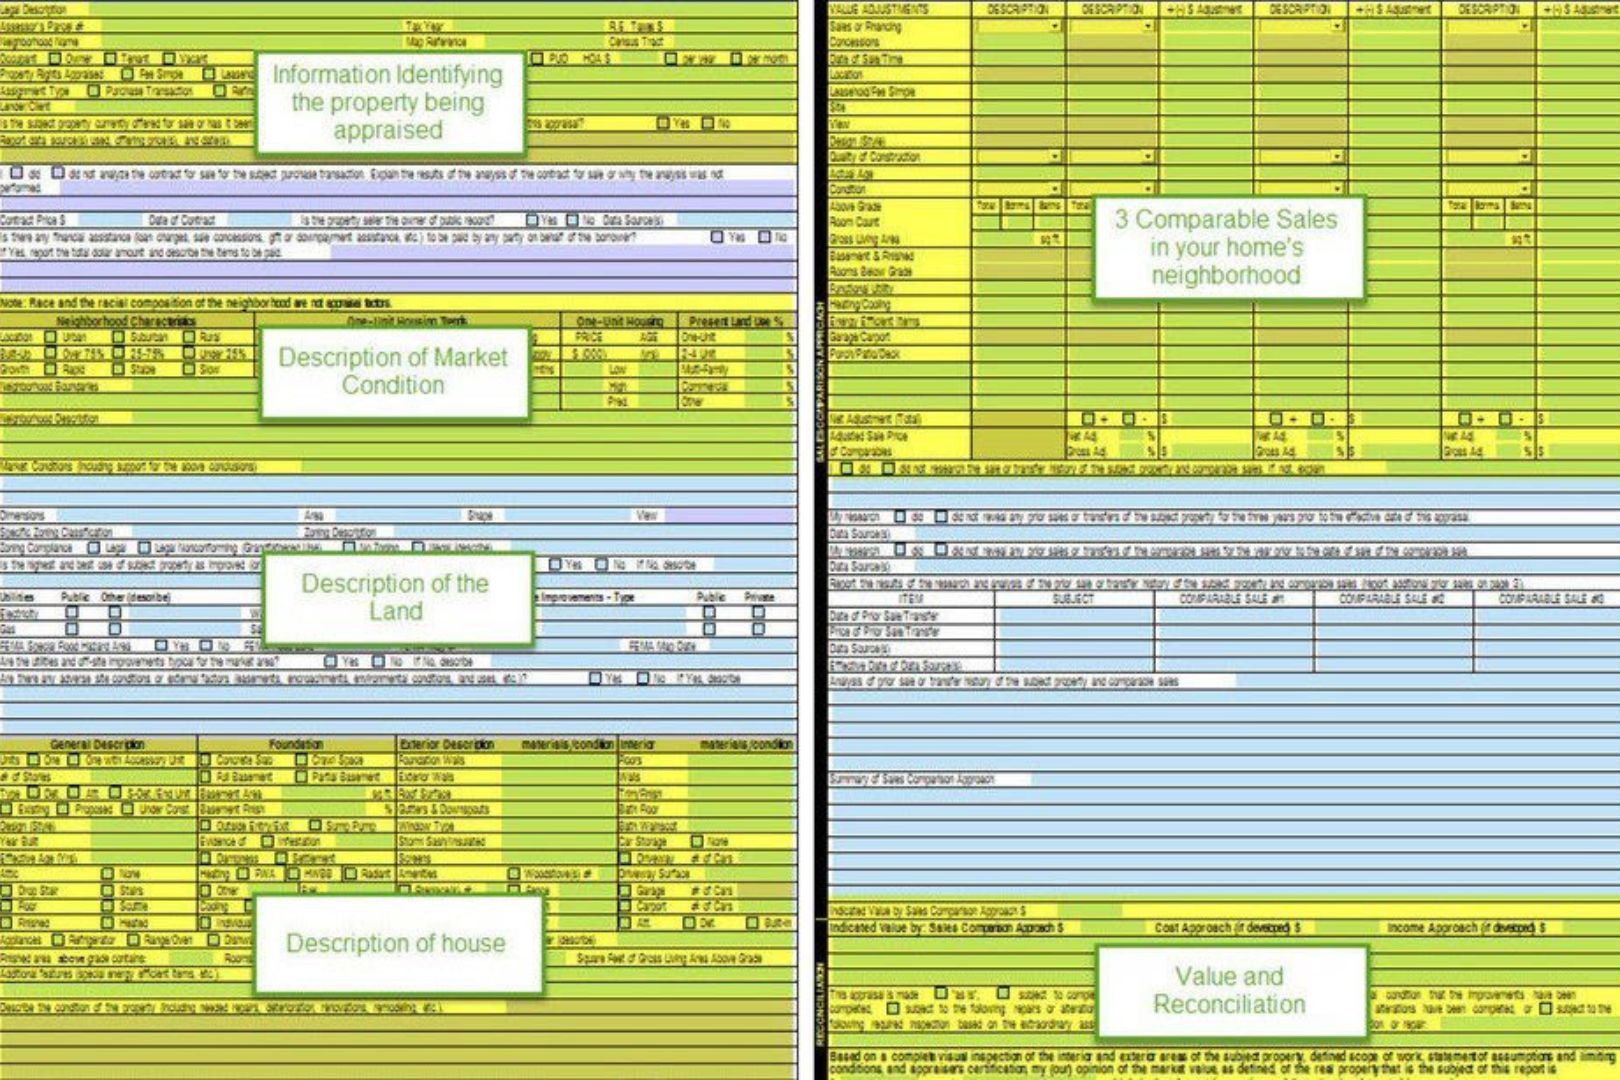
First, you’ve got the ‘Subject’ section. This is where you’ll find information about the property in question. It’s the ‘who’ and ‘where’ of the report. Details like the property address, legal description, and owner’s name are all nestled in here.
Next up is the ‘Contract’ section. If there’s a sale going on, this is where you’ll find the details. Think purchase price, contract date, and the like. It’s the ‘what’ and ‘when’ of the report.
Then we’ve got the ‘Neighborhood’ section. This is where the appraiser paints a picture of the area surrounding the property. It’s the ‘context’ of the report, giving you a snapshot of the local real estate market and the broader forces at play.
The ‘Improvements’ section is next in line. This is where the property itself comes under the microscope. Everything from the home’s condition to its unique features is laid out here. It’s the ‘how’ of the report, showing you what the property has (or doesn’t have) going for it.
Finally, we have the ‘Valuation’ and ‘Reconciliation’ sections. This is where the rubber meets the road. After considering all the data, the appraiser provides an estimated market value for the property and explains how they arrived at that figure. It’s the ‘why’ and ‘so what’ of the report, tying everything together.
FYI the Valuation sections encompasses the Sales Comparison Approach, the Income Approach and the Cost Approach.
Now, let’s talk key terms. ‘Subject’, ‘Contract’, ‘Neighborhood’, ‘Improvements’, ‘Valuation’, ‘Reconciliation’ – these are your new best friends. Get to know them, understand them, and you’ll be well on your way to mastering the art of reading appraisal reports.
Remember, knowledge is power. The more you understand the basics, the better equipped you’ll be to navigate the complex world of real estate appraisals. It’s not rocket science, but it does require a bit of dedication. Are you up for the challenge?
Tip 2: Understand the Purpose of the Appraisal

So, you’ve got the basics down. Great! But let’s not stop there. Why is the appraisal being done in the first place? Knowing the ‘why’ can provide a whole new perspective on the ‘what’.
There are several reasons an appraisal might be ordered. Maybe it’s for a home sale, or a refinancing deal. Maybe it’s for an estate settlement or a divorce settlement. Each purpose has its own unique considerations that can impact the final appraisal report.
Let’s say the appraisal is for a home sale. The main objective here is to determine if the contract price is in line with market realities.
On the other hand, an appraisal for a estate settlement may focus more on the market value as of “date of death”, which might not necessarily align with the current market value.
Why does this matter? Because the purpose of the appraisal can directly influence the report. It can affect the approach the appraiser takes, the comparables they select, and the adjustments they make.
In essence, understanding the ‘why’ behind the appraisal can help you better understand the ‘what’ in the report. It’s not just about reading the numbers, it’s about comprehending the story those numbers are telling.
So next time you’re handed an appraisal report, take a moment to ask – why was this appraisal done? The answer might just change the way you read the report.
Tip 3: Pay Attention to the Comparables
Alright, let’s chat about comparables, or “comps” as they’re often called in the biz. These are properties similar to the one being appraised that have recently sold or are currently on the market. They play a key role in determining the appraised value of a property. Think of them as the yardstick by which your property is measured.
The comparables are analyzed in the Sales Comparison Analysis section of an appraisal report. This section can seem like a jumble of numbers and terms, but it’s not as daunting as it looks.
Here’s the lowdown: each comp is listed with its selling price, and various features such as location, size, age, condition, and amenities. These features are compared to those of the property being appraised, and adjustments are made to the comp’s selling price based on the differences.
So, how do you make sense of this section? Here’s a tip: don’t get too caught up in the individual adjustments. Instead, look at the big picture. Are the comps similar to your property? Are they in the same neighborhood? Do they have similar features? If the answer is yes, then the appraised value is likely on point.
But if the comps seem off – maybe they’re in a different neighborhood, or they’re significantly larger or smaller – that could be a red flag. Remember, comps are a major factor in determining the appraised value. If they’re not truly comparable, the value could be skewed.
So, keep a keen eye on the comparables. They’re more than just numbers on a page – they’re a crucial piece of the appraisal puzzle.
Tip 4: Review the Adjustments

So, you’ve got your hands on an appraisal report and you’re cruising through the comparables. You’re feeling good, feeling confident. But then, you hit the adjustments section and suddenly, it’s like you’ve run into a brick wall. Don’t worry, it’s not as daunting as it seems. Let’s break it down.
Adjustments, in the simplest terms, are like the tweaks on a stereo equalizer. They’re used to level the playing field between the subject property and the comparables.
For instance, if a comparable property has a swimming pool and the subject property doesn’t, an adjustment is made to account for this difference. This ensures that you’re comparing apples to apples, not apples to oranges.
But how do you interpret this section? Well, it’s not about just looking at the numbers. It’s about understanding the story those numbers tell.
When you see a negative adjustment, it means the comparable is superior to the subject property in that aspect. A positive adjustment, on the other hand, indicates the subject property is superior.
Pro Tip
CBS – Comparable Better? – Subtract!
CIA – Comparable Inferior? – Add!
The key here is to not get lost in the figures. Instead, try to understand the rationale behind each adjustment. Why was it made? How does it affect the overall value? Remember, each adjustment is a piece of the puzzle that forms the final appraisal value.
Now, you might be wondering, “What if I disagree with an adjustment?” That’s a valid concern. The key questions is: “Is the adjustment market based? – Is it supported by evidence?
The appraisers support for his or her adjustments should be noted in the comments or addenda. Understand their perspective and use that knowledge to better serve your clients.
So next time you’re faced with the adjustments section, don’t panic. Take a deep breath, review each adjustment carefully, and try to see the story behind the numbers. It might take some practice, but once you get the hang of it, you’ll be able to navigate this section like a pro.
Tip 5: Don’t Ignore the Conditions and Assumptions

This section isn’t just small print. It’s the equivalent of the secret sauce in a gourmet recipe. Ignore it at your peril. The conditions and assumptions section of an appraisal report often gets sidelined, but it’s a crucial part of the whole narrative. It’s like the director’s commentary on a movie. You get to understand the ‘why’ behind the ‘what’.
Why is it so important? It’s because this section outlines the terms under which the appraisal was made. It’s a list of all the factors that the appraiser assumed to be true when determining the value of the property.
This could include anything from zoning laws to the physical condition of the property. It’s the lens through which the appraiser viewed the property, and it can significantly impact the final appraisal value.
Think of it like this: you’re a detective, and this section is a vital clue that helps you piece together the full picture. If you don’t consider these conditions and assumptions, you might end up with a distorted understanding of the property’s value.
So, how do you navigate this section? Start by reading it carefully. Don’t skim. Each assumption or condition is a piece of the puzzle. If something seems off or doesn’t make sense, flag it. Ask questions. Challenge assumptions.
Remember, your job is to get a complete and accurate understanding of the property’s value. You can’t do that if you’re working with incomplete or inaccurate information.
The conditions and assumptions are not just a footnote. It’s a crucial part of the appraisal report that deserves your full attention. Ignore it at your own risk.
Unfortunately, assumptions can be written anywhere in the report, but they are required to be prominent wherever they are placed.
Tip 6: Look for Errors

It’s a little-known secret that even appraisal reports, as official as they may seem, can be prone to human error. And while it’s not exactly like hunting for Waldo, spotting these mistakes requires a keen eye and a solid understanding of the appraisal process.
Common errors can range from minor typos to major miscalculations. They might be as simple as misspelled names and incorrect property addresses, or as significant as erroneous square footage calculations and inaccurate comparable sales data. These mistakes, while they might seem trivial, can have a profound impact on the final appraisal value.
So, how do you play detective with an appraisal report? First, don’t rush. Take your time to thoroughly review each section of the report.
Pay special attention to the property description and the comparable sales used. Ensure the information aligns with what you know about the property and the local market.
Second, question everything. Does the reported square footage match your records? Do the comparable sales seem appropriate? If something seems off, it probably is.
Lastly, don’t hesitate to reach out to the appraiser for clarification. Remember, it’s not about challenging their expertise but about ensuring accuracy. After all, we’re all human and mistakes do happen.
Looking for errors isn’t about being nitpicky—it’s about safeguarding your client’s interests and maintaining the integrity of the transaction. So, put on your detective hat and start scrutinizing those appraisal reports.
Tip 7: Consult with the Appraiser

Ever heard the saying, “two heads are better than one?” It rings true in the world of real estate appraisals as well. The final, and arguably one of the most important, tips is to establish an open line of communication with the appraiser.
Why? Because appraisers are the masters of their craft, they hold a wealth of knowledge that can provide you with invaluable insights into the appraisal report.
Now, you might be thinking, “Great, but how do I approach this conversation without sounding like I’m questioning their expertise?” Good question. Here’s how.
Firstly, approach the conversation with genuine curiosity. You’re not there to challenge their appraisal, but to understand it. Ask them to explain the reasoning behind their choices, particularly if something isn’t clear to you.
A phrase like “Could you help me understand why this particular comparable was chosen?” comes across as much more collaborative than confrontational.
Secondly, make it a two-way street. Share your knowledge about the property and its neighborhood. You might have information that the appraiser wasn’t aware of, like upcoming developments in the area or recent sales that weren’t listed publicly. This can be incredibly beneficial to both parties.
Finally, remember to respect their time and expertise. Appraisers are busy professionals, so keep your questions concise and to the point.
And remember, while it’s okay to ask for clarification, it’s not okay to pressure an appraiser to change their valuation. Their independence and objectivity are crucial aspects of their role.
In a nutshell, don’t be a stranger to the appraiser. A little bit of communication can go a long way in helping you understand an appraisal report. Plus, it can strengthen your professional relationships, making future appraisals a smoother process.
Conclusion
Alright, so we’ve covered a fair bit of ground here. Let’s take a moment to circle back and recap the seven pointers that can make reading appraisal reports less of a headache and more of a breeze for you.
First off, get your head around the basics. Know the structure, understand the key terms. Next, grasp the purpose of the appraisal. It’s not just numbers and figures; there’s a story behind it all. Then, give due attention to the comparables and adjustments. They’re not just fillers; they play a significant role in the valuation.
Also, don’t let your eyes glaze over the conditions and assumptions section. It’s not just fine print; it can seriously impact the appraisal value. And while you’re at it, be on the lookout for errors. They’re not just typos; they can skew the entire report.
Lastly, don’t hesitate to reach out to the appraiser. They’re not just report generators; they can provide valuable insights and clarifications.
Well, we’ve come to the end. I really hope this guide has helped you to understand appraisal reports better. If I can be of service to you as you navigate the world of appraisals, please reach out. I am always happy to help.
Keep learning, keep growing, and keep rocking the real estate world!