by Conrad Meertins | Aug 12, 2024 | Valuation

We all obsess over condition—whether it’s the state of our bodies, our cars, or our homes. But when it comes to our homes, does obsession really matter? Sometimes, we get so fixated on the imperfections that we forget the bigger picture, especially when the market conditions take the driver’s seat.
Today, I want to share some observations on how a home’s condition influences its ability to sell, particularly in different market scenarios. By the end, you’ll see how I, as an appraiser, account for condition when preparing reports.
Condition in a Seller’s Market

In a seller’s market, where inventory is low and demand is high, condition still matters, but it’s not always the deal-breaker you might think. Buyers are often so eager to secure a home that they’re willing to overlook flaws and even pay a premium for properties that wouldn’t ordinarily justify such prices.
Why? It all comes down to competition. Think of an auction—when everyone wants the same item, the bidding war pushes prices up, even if the item isn’t perfect. Similarly, in a hot market, buyers are more likely to bid on a home, even if it’s not in pristine condition.
This is where knowing the market environment becomes crucial. If you’re a seller, having a trusted appraiser or realtor who understands the market dynamics can give you a significant edge.
Pro Tip for Realtors: While the market may allow for higher asking prices, be careful not to overestimate. The appraiser still needs to justify the price based on comparable sales, so ensure there are similar homes in the area that have sold for similar prices despite their condition.
Condition in a Buyer’s Market
Now, let’s flip the script. In a buyer’s market—high inventory, low demand—buyers can afford to be picky. This is when condition becomes a critical factor in a home’s saleability. Just to clarify, we’re not in a buyer’s market right now, so don’t get too excited. But if we were, the scenario would be quite different.
Imagine walking into a burger joint where a cheeseburger and a sirloin steak are the same price. Which would you choose? Most would opt for the steak, of course!
In this analogy, the steak represents a home in great condition, while the cheeseburger is a home that needs some work. Both are listed at similar prices, but with no competition, buyers will naturally gravitate toward the better option.
For Sellers: In such a market, if your home is in less-than-perfect condition, be prepared to adjust your asking price to make it more appealing. Remember, when buyers have options, they’re likely to go with the one that offers the best value.
Accounting for Condition in an Appraisal Report

So, how do I, as an appraiser, adjust for condition? Let me walk you through one of my methods. When appraising a property, I start by defining criteria that help me find comparable homes on the market.
For instance, if I’m appraising a 1,000-square-foot, 3-bedroom, 1-bathroom ranch-style home, I’ll look for similar homes that sold within the past year, within a mile of the subject property.
In a densely populated area, this approach should yield around 30 comparable homes. Next, I analyze their condition via the local MLS, assigning each a condition rating (Fair, Average, Avg/Good, Good). Once I have this data, I create a pivot table that gives me the median sale price for each condition category.
Here’s an example of what the data might look like:
|
Condition
|
Median Sale Price
|
| Fair |
$160,000 |
| Average |
$190,000 |
| Avg/Good |
$210,000 |
| Good |
$250,000 |
This table tells me that in this market, buyers are willing to pay $20,000 more for a home in Avg/Good condition compared to one in Average condition, and $60,000 more for a home in Good condition. This is a defensible, market-driven approach to account for condition when setting a list price or producing an appraisal report.
Conclusion
As you can see, condition is important, but the type of market you’re in dictates how important it is. In a seller’s market, it’s less of a factor; in a buyer’s market, it’s crucial. By analyzing similar homes, you can quantify just how much more (or less) someone might pay based on condition.
The bigger the sample size, the more reliable the analysis. I aim to gather at least 30 homes to ensure that my clients receive market-based evidence on how condition affects sales price.
So, the next time you think about a home’s condition, consider the market first. Act with knowledge, consult with a trusted appraiser, and set your price accordingly—don’t let condition become an obstacle to selling your home.
by Conrad Meertins | Jul 16, 2024 | Valuation

Curious why your 2-4 family property’s appraisal seems so complex? You’re not alone. Many Louisville homeowners and realtors are surprised to discover that multi-family appraisals are a whole different ballgame compared to single-family homes.
But don’t worry – we’re about to unveil the mystery behind 2-4 family home appraisals in the Derby City.
Imagine you’ve just inherited a charming duplex in the Highlands. You’re excited about the potential, but when you mention getting it appraised, your realtor friend looks at you with a mix of sympathy and amusement. “Oh honey,” she says, “you’re in for a wild ride.”
That’s the moment you realize: multi-family appraisals are not just about counting bedrooms and measuring square footage. They’re about unlocking the true potential of your property in Louisville’s dynamic real estate market.
The Multi-Family Appraisal Maze: A Louisville, KY Perspective

In the world of Louisville residential appraisers, 2-4 family properties are the ultimate puzzle. Unlike single-family homes, where appraisers mainly focus on adjusted sales prices of comparable properties, multi-family appraisals dive deeper.
They’re like peeling an onion – layer upon layer of analysis.
Here’s what makes multi-family home appraisals in Louisville unique:

Price per Bedroom: In a city where college students and young professionals are always hunting for rentals, this metric is gold. It helps compare properties with different bedroom counts, crucial in areas near the University of Louisville or Bellarmine University.
Price per Unit: Essential for investors eyeing properties in up-and-coming neighborhoods like Butchertown or NuLu. This metric helps normalize values across duplexes, triplexes, and fourplexes.
Price per Room: Crucial when comparing properties in diverse areas, from Old Louisville to the East End. It accounts for differences in layout and living spaces, which can vary widely in Louisville’s eclectic housing stock.
Price per Gross Building Area (GBA): Vital in a market where historic properties often compete with new developments. This metric helps level the playing field between a renovated Victorian in Crescent Hill and a modern fourplex in the Highlands.
But why does this matter to you? Because understanding these metrics can be the difference between a good investment and a great one in Louisville’s competitive market.
Cracking the Code: How Louisville Appraisers Use These Metrics

Louisville’s top residential appraisers don’t just crunch numbers; they tell the story of your property’s potential. They use these metrics to:
Select the most relevant comparable sales in your neighborhood. In a city as diverse as Louisville, this means finding properties that truly match yours, whether it’s a historic conversion in Old Louisville or a purpose-built multi-family in St. Matthews.
Make precise adjustments that reflect Louisville’s unique market conditions. Our city’s mix of urban, suburban, and historic districts means each area has its own nuances that impact property values.
Provide a rock-solid final valuation that stands up to scrutiny. In Louisville’s fast-moving market, accuracy is key for both buyers and sellers.
For homeowners and realtors in Louisville, this means:

Homeowners: You need to see your 2-4 family property through an investor’s eyes. Keep detailed records of your property’s specifications and rental history. In Louisville’s seasonal rental market, tracking occupancy rates and rental income throughout the year can provide valuable insights.
Realtors: Prepare to become a multi-family property detective. Your ability to analyze and present these metrics can set you apart in Louisville’s competitive real estate scene. Understanding how these metrics vary across different neighborhoods – from the Parklands to Portland – can make you an invaluable resource to your clients.
The Income Approach: A Crucial Component in Louisville’s Multi-Family Appraisals
When it comes to 2-4 family properties in Louisville, the income approach takes center stage. This method looks at your property’s potential to generate rental income – a key factor for investors in our growing city.
Here’s why it matters:
Gross Rent Multiplier (GRM): This quick calculation helps investors compare properties across different Louisville neighborhoods. A lower GRM in an up-and-coming area like Germantown might signal a good investment opportunity.
Capitalization Rate (Cap Rate): This metric is crucial for understanding the potential return on investment. In Louisville’s diverse market, cap rates can vary significantly between established areas like the Highlands and emerging neighborhoods like Schnitzelburg.
Net Operating Income (NOI): This figure accounts for Louisville-specific expenses like property taxes, insurance, and maintenance costs, which can vary widely across the city.
Understanding these income-based metrics can help you make informed decisions in Louisville’s multi-family market, whether you’re looking at a duplex in Clifton or a fourplex in Fern Creek.
Utility Considerations: A Hidden Factor in Louisville Multi-Family Appraisals

In Louisville’s varied housing stock, utility setups can significantly impact a multi-family property’s value. Here’s what you need to know:
Separate vs. Common Utilities: Properties with separate utilities for each unit often command higher valuations in Louisville. They’re particularly attractive in areas with a high concentration of young professionals, like the Highlands or NuLu.
Energy Efficiency: With Louisville’s hot summers and cold winters, energy-efficient properties can command premium rents. Upgrades like new windows or HVAC systems can significantly boost your property’s appeal and value.
Local Regulations: Be aware of Louisville Metro’s regulations regarding utility billing in multi-family properties. Compliance with local laws is crucial for maintaining your property’s value and avoiding legal issues.
Your Next Move in Louisville’s Multi-Family Market

Now that you’re armed with this insider knowledge, what’s your next step? Whether you’re considering buying a duplex in Germantown or selling a fourplex in Clifton, understanding these appraisal secrets gives you an edge.
Here are some actionable steps:
Research Your Neighborhood: Louisville’s neighborhoods each have their own character and market dynamics. Understand how your property fits into the local context.
Keep Detailed Records: Track your property’s rental history, occupancy rates, and any improvements you’ve made. This information is gold for appraisers and potential buyers.
Stay Informed: Louisville’s real estate market is always evolving. Keep an eye on local development plans and market trends that could impact your property’s value.
Consider Professional Management: In a competitive market like Louisville, professional property management can help maximize your property’s potential and value.
Plan for the Future: Whether it’s energy-efficient upgrades or unit reconfigurations, strategic improvements can significantly boost your property’s appraisal value.
Ready to navigate the exciting world of multi-family properties in Louisville? Don’t go it alone. Partner with a Louisville residential appraiser who specializes in 2-4 family home appraisals. They’ll help you unlock the true potential of your property and make informed decisions in our vibrant Louisville market.
Remember, in the world of multi-family properties, knowledge isn’t just power – it’s profit. Are you ready to see your Louisville property in a whole new light? The key to unlocking your property’s true potential is just an appraisal away.
Don’t let the complexity of multi-family appraisals hold you back from making smart investment decisions in the Derby City’s dynamic real estate market.
by Conrad Meertins | Feb 27, 2024 | Market Trends, Valuation

In the realm of real estate, the synergy between homeowners, realtors, and appraisers is not just beneficial; it’s essential.
Drawing from Stephen Covey’s 6th habit, “Synergize”, we see the immense value in collaborative efforts, especially when it comes to the precise task of home valuation. This principle underscores the strength found in teaming up, highlighting how collective inputs lead to superior outcomes.
The Unique Roles in Real Estate Transactions

Realtors are the navigators of the real estate transaction process, masters at brokering deals to ensure fairness and optimal outcomes for their clients. With an in-depth knowledge of market areas honed over years, they are pivotal in guiding homeowners through the complexities of selling or buying a home.

Appraisers, on the other hand, bring a different set of skills to the table. As valuation experts, they delve into the nitty-gritty details of property value, armed with data and trends to pinpoint the most accurate market value.
Their expertise becomes particularly crucial in fluctuating markets, where accurate valuations can make or break a deal.
The Synergy in Action: A Real-World Scenario
Consider a homeowner eager to sell their property. They believe their home is worth $350,000, while their realtor, considering current market dynamics, suggests a starting point of $300,000.
Here, the realtor could either acquiesce to the homeowner’s wishes or provide detailed market insights to align expectations. This is where an appraiser’s expertise becomes invaluable.
Data and Evidence: Understanding Louisville’s Market
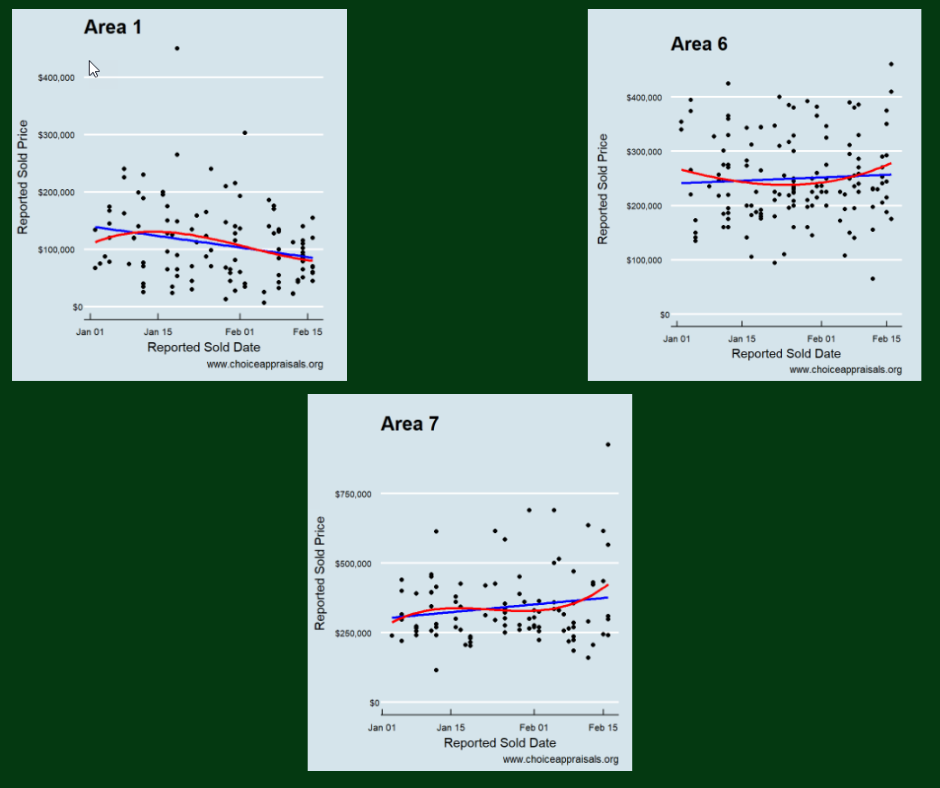
The above graph highlights the trend for homes that sold in MLS Area 1, Area 6, and Area 7. While Area 1 experienced a decline in sales prices with 114 sales, Areas 6 and 7 showed an uptick, boasting 145 and 96 sales, respectively.
The above graph highlights the weekly volume of sales in Louisville, KY. since week one of 2024

The above graph illustrates the median sale price for each MLS area in Louisville, KY over the first 7 weeks of 2024. As can be seen from the above charts, in week 7 of 2024, Louisville’s real estate market presented varied trends across its MLS areas.
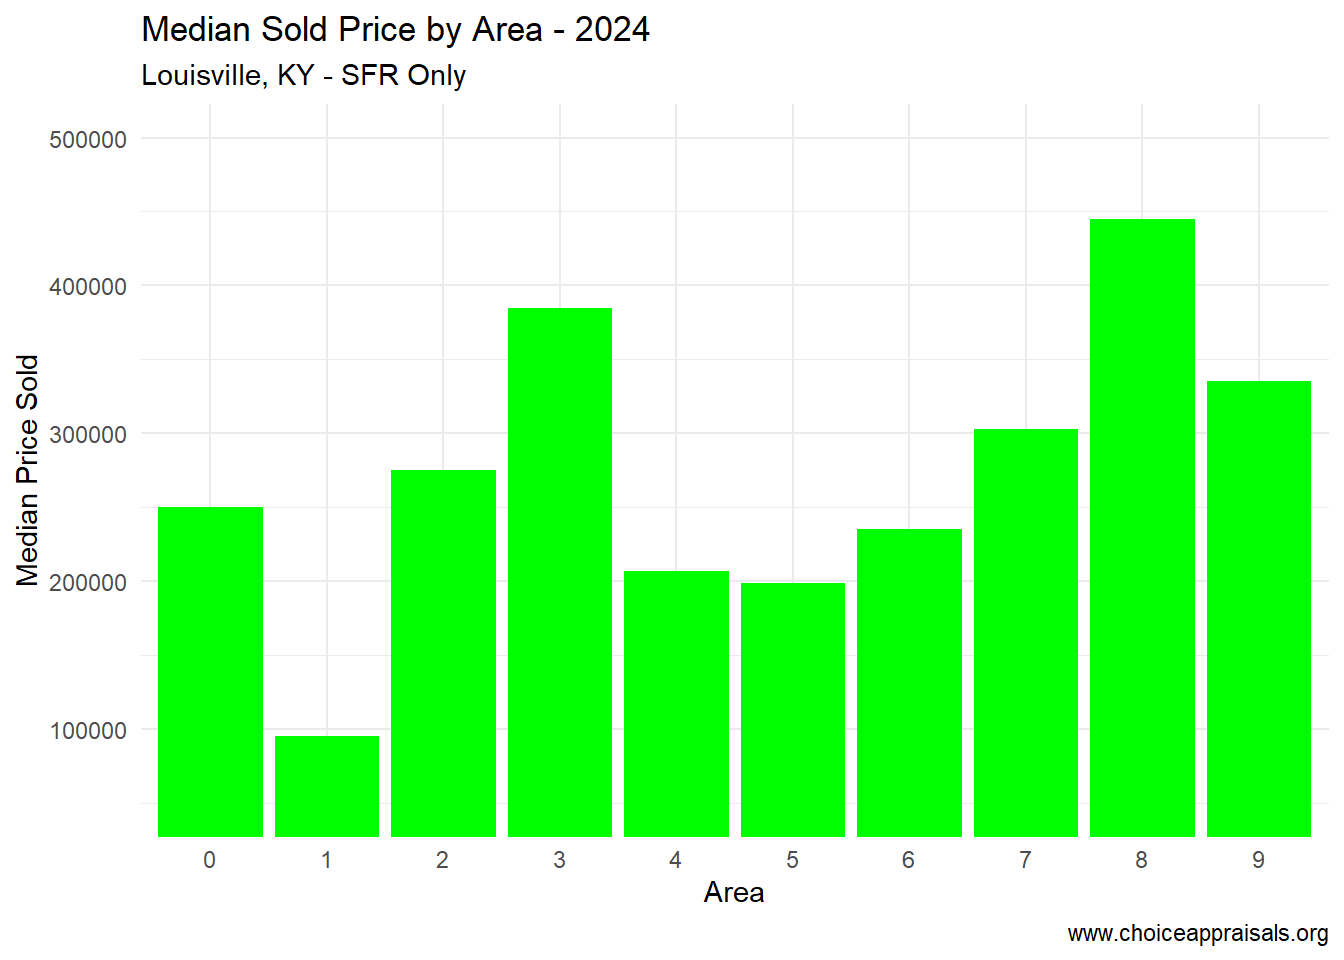
The average days on market hovered between 20 and 25, with an overall median sales price of $249,000 across Louisville.
However, disparities exist, with Area 3 approaching a median of $400K and Area 8 nearing $450K. Such granular data is crucial for appraisers and realtors alike to provide homeowners with accurate, realistic valuations.
Leveraging Synergy for Success

When realtors and appraisers collaborate, sharing insights and data, they ensure homeowners receive the most accurate valuation, tailored to the nuanced dynamics of their specific MLS area.
This synergy not only enhances trust among all parties but also secures a smoother transaction process, grounded in realism and mutual understanding.
Embrace Collaboration

For homeowners, understanding the value of your home is more nuanced than it might appear. Engage both your realtor and a local Louisville appraiser in the conversation.
Realtors, don’t hesitate to bolster your market knowledge with insights from appraisers. Appraisers, your expertise is more critical than ever in today’s data-rich age—collaborate with realtors to demystify market trends for homeowners.
The Winning Formula
Synergy, as Stephen Covey highlighted, is about producing a collective outcome that surpasses what individuals could achieve alone.
In Louisville’s diverse real estate landscape, embracing this collaborative spirit ensures that homeowners, realtors, and appraisers alike can navigate the valuation process with confidence, accuracy, and success.
Let’s work together, leveraging our unique strengths for the common goal of transparent, fair, and effective real estate transactions. Go Louisville, where synergy is indeed where it’s at!
by Conrad Meertins | Jan 30, 2024 | Market Trends

In the heart of Louisville, real estate embodies a simple truth: everyone can indeed win. As an appraiser and an optimist who always looks for the silver lining, I see the essence of ‘Win-Win’ deeply ingrained in the process of buying and selling properties.
Just think of the definition of market value—a probable price struck when buyers and sellers, each acting in their own best interest without pressure, reach a harmonious agreement. This is the epitome of ‘Win-Win’ in our world.
But let’s get practical—how does this philosophy translate into the nuts and bolts of property valuation and deciding how to list your home?
It all begins with facts. A quote that I love is as follows: True victory is not in the acquisition alone but in the integrity of the transaction. Misrepresentation benefits no one.
That’s why due diligence is a cornerstone. And for us real estate professionals, our role is crucial—we must anchor our valuations in reality, not fancy. In this context, thinking ‘Win-Win’ is built on understanding the facts of our current real estate landscape in Louisville.
Let’s lay out these facts, not with complexity but with the clarity that empowers. With a clear view of how the market has fared in the first month of 2024, we pave the way for decisions that benefit all.
Active Listings: Climbing Towards More Opportunities
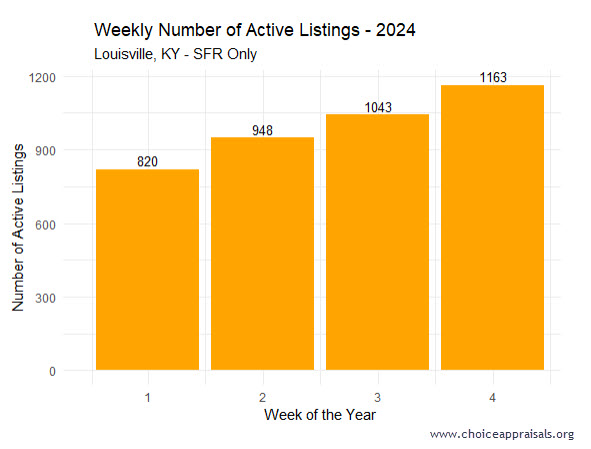
The bar graph illustrates an upward trend in the number of active listings from 820 in the first week to 1163 by the fourth week.
A growing inventory could be indicative of two trends: either sellers are entering the market to take advantage of favorable conditions, or it could suggest a slowdown where listings are staying on the market longer than in previous periods.
It’s important for agents and homeowners to watch this trend closely, as a high inventory level could lead to a more competitive market for sellers, possibly affecting prices and selling strategies.
Cumulative Sales: Assessing the Market’s Lift-Off
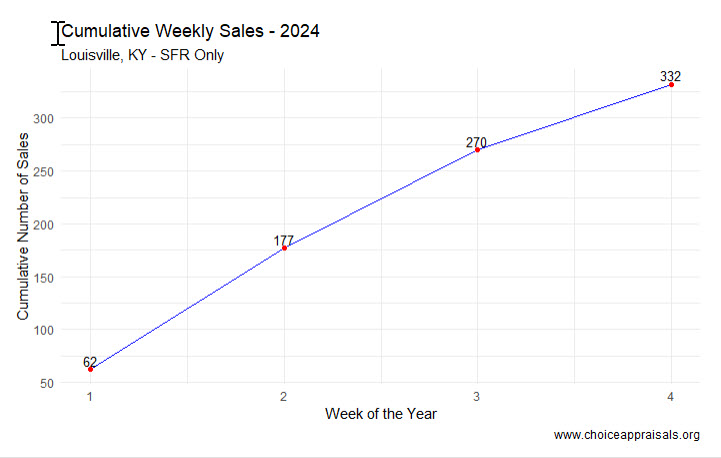
The “Cumulative Weekly Sales – 2024” graph for Louisville, KY, depicts an upward trend in property sales over the first month, with sales rising from 62 to 332. While at first glance this seems to indicate a thriving market, we have to be careful.
The trend does not necessarily signify robust growth without a benchmark. Seasonal influences also play a crucial role in real estate activity. So, it’s important to question whether this early-year sales uptick means.
Time will tell but for the sake of home buyers, realtors and appraisers, we hope it’s a sign of greater sales volume than last year.
In this context, a Win-Win scenario materializes when everyone leverages this data coupled with the information about active listings to make decisions that reflect both the present moment and the potential of the market’s future.
MLS Areas: Decoding the Sales Price Variance
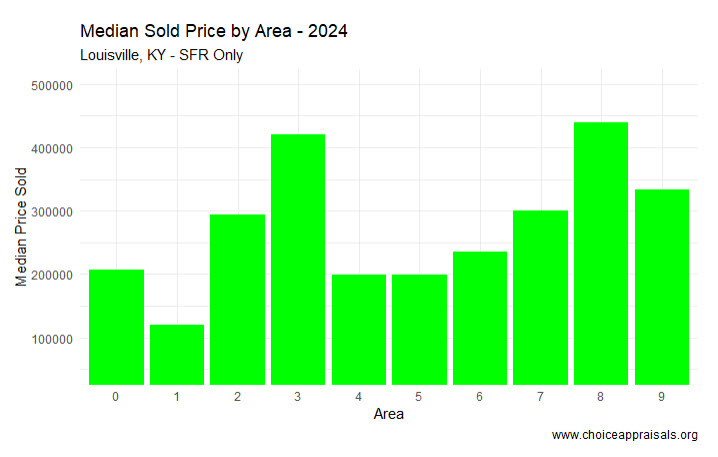
The graph showcasing the “Median Sold Price by Area – 2024” in Louisville, KY, for single-family residences reveals varied median prices across nine different areas.
This variance highlights the diverse nature of the housing market within the city, suggesting that certain areas are more in demand or possess attributes that command higher prices—factors such as school districts, proximity to amenities, and neighborhood desirability might be influencing these figures.
Notably, Area 8 stands out with a median price significantly higher than the others, which could indicate a premium neighborhood or area with larger or more luxurious homes. Conversely, Areas 1 exhibits a notably lower median sold price, which could reflect a variety of factors such as older homes, or more modest housing options.
Interesting Fact: Area 1 had the second highest amount of sales volume for the first four weeks of January 2024 with 47 sales. I personally have done more Louisville appraisals in this part of town in the past 30 days. Area 8 came in at #5 with 35 sales. It’s funny how the winner changes when we change the lens that we look through.
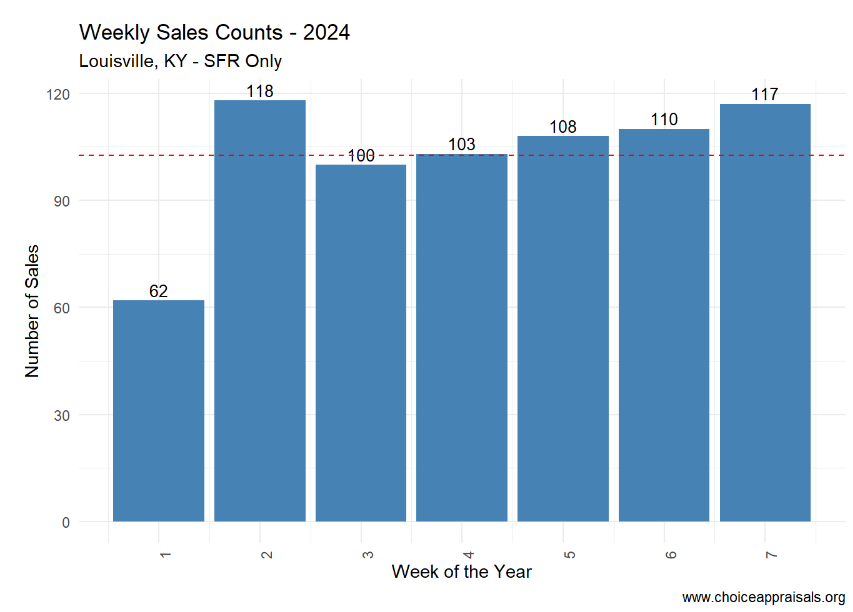
Weekly Sales: Unpacking the Market’s Pulse
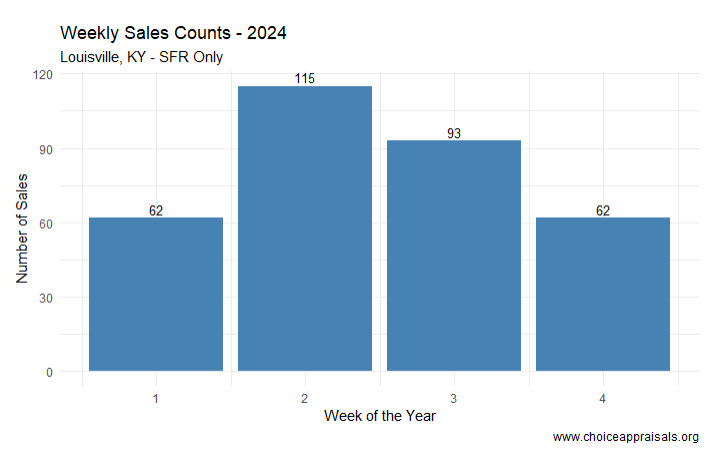
The “Weekly Sales Counts – 2024” graph for Louisville, KY, presents a roller coaster like sales pattern within the first month of the year. We begin with 62 sales in week one, surge to 115 sales in the second week, then experience a decrease to 93 in week three, before returning to the starting point of 62 sales in week four.
This ebb and flow could reflect a number of underlying market dynamics. The initial rise in sales might indicate a wave of activity often seen at the beginning of a new year, as buyers and sellers enter the market with fresh goals.
Then, week three seems to whisper, “Let’s just slow down and think about this,” possibly due to buyer hesitancy or sellers holding out for better offers. By week four, we’re back to where we started, which could be a sign of market stabilization—or maybe it’s just taking a nap after the excitement of the year end – I think/hope it’s the latter!
The subsequent fall could suggest that this initial enthusiasm is tempered by external factors, such as economic news or interest rate adjustments, which may cause market participants to act more cautiously.
Overall, this data underscores the importance of monitoring weekly market movements closely, as they can provide early indications of shifts in buyer and seller behavior that could impact strategy and decision-making.
Valuations: Crafting a Win-Win Strategy
When it comes to valuations, ‘Think Win-Win’ is about fairness and balance. For realtors and clients in Louisville, here’s how you can put this into practice:
Stay Informed and Educate: The real estate market is dynamic, and being well-informed is key. An educated homeowner is more likely to price their home accurately, and an educated buyer can make a fair offer.
Regular Market Analysis: Keep an eye on how homes are priced in different areas. Realtors should provide homeowners with a regular analysis of how the market is moving, not just in terms of price but also in how long homes stay on the market.
Set Realistic Expectations: Help clients set realistic expectations based on market data. If the market is indicating a decrease in demand, homeowners should be prepared for potentially longer selling times.
Listen and Adapt: A Win-Win situation comes from understanding what the other party values. Listen to buyers and sellers carefully and adapt your strategy to align with their goals.
Prepare for Different Scenarios: The market can shift unexpectedly. Have a plan for different scenarios, whether it’s a sudden uptick in interest rates or a change in buyer sentiment.
Conclusion
In the Louisville market, adopting a ‘Think Win-Win’ approach in real estate isn’t just idealistic, it’s practical. It’s about creating transactions where buyers and sellers walk away satisfied, where the value is fair, and where the community thrives on the integrity of its dealings.
I invite you to reflect on this philosophy and how it has shaped your experiences in real estate. Have you encountered situations where the Win-Win approach turned a negotiation around or created a surprising opportunity? Share your stories and insights. Let’s continue the conversation and learn from each other, so we can all reap the rewards of a market that works for everyone.
by Conrad Meertins | Jan 21, 2024 | Valuation

Are you striving to master the art of perfecting listing prices in today’s dynamic real estate market?
Understanding the home appraisal process in Louisville, KY is a crucial step in this journey. Imagine being the realtor or homeowner who always knows the property’s true worth, navigating the valuation landscape with ease.
It’s not just about the numbers; it’s about interpreting them in the context of a constantly evolving market.
This blog delves into the subtleties of real estate valuation, examining the critical aspects that influence it, from an appraiser’s local market knowledge to the unique features of properties, and adapting to rapid market changes.
By aligning these insights with Stephen Covey’s “First Things First” principle, my goal is to help you to navigate these complexities effectively, ensuring more informed decision-making and successful client outcomes.
Common Valuation Challenges

A critical aspect often encountered in real estate transactions in Louisville, and in most areas, is the difference between the appraised value and market value of properties.
This difference, even as appraisers strive to provide the current market value, can largely be attributed to the appraiser’s expertise and understanding of the local market.
Appraiser’s Expertise and Local Market Knowledge
Appraisers strive to estimate a property’s value based on a set of standardized criteria, including the analysis of comparable sales, property condition, and market trends.
However, the depth of an appraiser’s local market knowledge can significantly influence the accuracy of the appraisal. A home appraiser with extensive experience and familiarity with a specific area of Louisville is more likely to provide a valuation that closely reflects the current market conditions.
They can better understand and interpret nuances like local demand trends, and even subtle influences like school districts or future development plans.
In contrast, an appraiser who may not be as deeply versed in the specifics of a locale might miss these subtleties. This gap in local insight can lead to variances between the appraised value and the market value as perceived by buyers and sellers in that specific market.
Navigating the Valuation Landscape
For realtors, understanding this aspect is crucial. Recognizing the importance of an appraiser’s local expertise can help in setting realistic expectations for both buyers and sellers.
It also underscores the value of engaging appraisers who are well acquainted with the property’s area, ensuring a more accurate reflection of the current market value.
Encourage your sellers to ask questions that will indicate that the appraiser knows the area. What if his answers sound fishy? Request another appraiser from the bank.
In line with Stephen Covey’s “First Things First” principle, prioritizing this understanding can greatly aid in navigating the valuation landscape, allowing for more informed decision-making and effective client guidance in real estate transactions.
Recognizing and Communicating Unique Property Features

In the context of home appraisals, understanding how unique property features are evaluated is another crucial part of the valuation puzzle. This knowledge is especially significant when bridging the gap between an appraiser’s valuation and a buyer’s perception of value.
How Appraisers View Unique Property Features
Appraisers approach property evaluation methodically, assessing a spectrum of features from basic structural elements to unique attributes.
These unique features might include custom interior designs, recent renovations, or exceptional architectural styles. Each of these is scrutinized for its impact on the property’s overall value.
However, the value that appraisers assign to these features might not always align with a potential buyer’s perceived value.
A feature that significantly enhances the aesthetic or functional appeal of a property, like a professionally landscaped garden, may be highly attractive to certain buyers.
Yet, in terms of appraised value, this feature might not lead to a proportional increase. This discrepancy arises because while appraisers acknowledge these features, their assessment is grounded in quantifiable impact more than subjective appeal.
The Realtor’s Role in Highlighting Unique Features
For realtors, this underscores the importance of effectively recognizing and communicating these features during transactions. Understanding the appraiser’s perspective on unique property features allows realtors to better manage client expectations regarding valuation.
Moreover, it empowers realtors to highlight these features in ways that resonate with potential buyers, showcasing the added value these unique aspects bring to the property.
By aligning appraisal insights with strategic communication, realtors can navigate the valuation landscape more effectively, ensuring a smoother transaction process and potentially enhancing property appeal in the competitive real estate market.
Adapting to Market Changes and Informing Appraisers

Understanding the appraisal of unique property features is just one facet; equally important is adapting to and proactively addressing rapid market changes. These fluctuations can significantly influence property valuations, and understanding how to communicate these shifts to appraisers is critical.
The Impact of Rapid Market Changes on Valuations
The real estate market in Louisville, KY and across the country is inherently dynamic, often influenced by factors like economic shifts, interest rates, and local developments.
These changes can swiftly alter property values, sometimes quicker than can be reflected in an appraisal based on historical data. For instance, a sudden surge in demand in a particular area might significantly increase property values, a change that recent sales data may not fully capture.
Proactive Communication with Appraisers
In these scenarios, the role of a realtor extends beyond just understanding market dynamics. It involves actively communicating these shifts to appraisers early in the valuation process.
While appraisers are experts in their field, they might not always be immediately aware of very recent market changes. By providing appraisers with the latest market insights, realtors can ensure that these factors are considered in the home appraisal analysis.
This proactive approach aligns with Stephen Covey’s “First Things First” strategy. Prioritizing the sharing of up-to-date market information with appraisers helps ensure that the valuation accurately reflects current market conditions.
This not only aids in creating more accurate appraisals but also helps in setting realistic expectations for both buyers and sellers.
Staying Informed and Adaptable
For realtors, staying informed about the latest market trends and developments is imperative. This means regularly reviewing market reports, engaging with local real estate networks, and maintaining a pulse on any sudden changes.
By being well-informed and adaptable, realtors can effectively guide their clients through the complexities of real estate transactions in a rapidly changing market.
Mastering the Art of Real Estate Valuation

The journey through the landscape of real estate valuation is both challenging and rewarding.
Understanding the depth of an appraiser’s local market knowledge, recognizing the impact of unique property features, and staying agile in the face of market dynamics are not just tasks – they are essential skills for today’s realtors.
By proactively communicating with appraisers, aligning with the latest market trends, and effectively highlighting the unique aspects of properties, realtors can significantly enhance their service to clients.
This approach, rooted in the wisdom of “First Things First,” is not just about adapting strategies; it’s about foreseeing opportunities and navigating the real estate market with confidence and expertise.
As we embrace these principles, we not only succeed in individual transactions but also contribute to the broader narrative of real estate professionalism and homeowner satisfaction.